Stock Analysis
- United States
- /
- Trade Distributors
- /
- NYSE:BCC
Boise Cascade (NYSE:BCC) sheds 11% this week, as yearly returns fall more in line with earnings growth


The Boise Cascade Company (NYSE:BCC) share price has had a bad week, falling 11%. But that doesn't change the fact that the returns over the last half decade have been spectacular. Indeed, the share price is up a whopping 405% in that time. So we don't think the recent decline in the share price means its story is a sad one. Of course what matters most is whether the business can improve itself sustainably, thus justifying a higher price.
While the stock has fallen 11% this week, it's worth focusing on the longer term and seeing if the stocks historical returns have been driven by the underlying fundamentals.
View our latest analysis for Boise Cascade
To quote Buffett, 'Ships will sail around the world but the Flat Earth Society will flourish. There will continue to be wide discrepancies between price and value in the marketplace...' By comparing earnings per share (EPS) and share price changes over time, we can get a feel for how investor attitudes to a company have morphed over time.
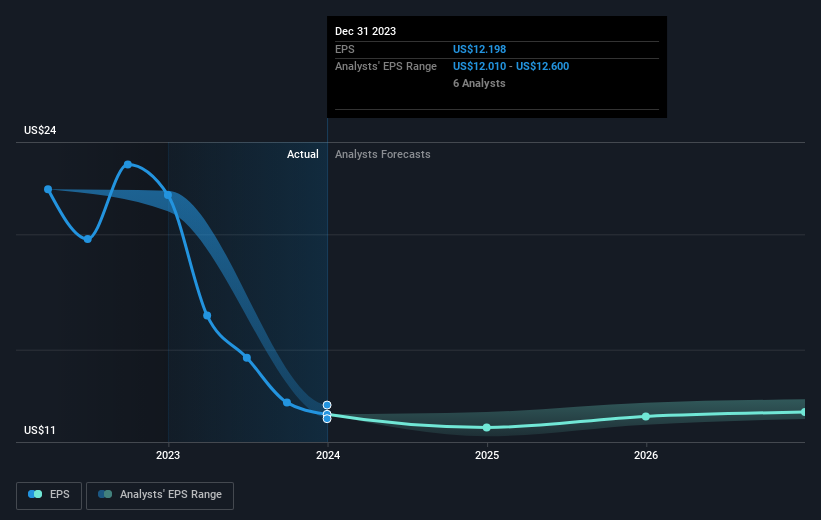
Over half a decade, Boise Cascade managed to grow its earnings per share at 88% a year. The EPS growth is more impressive than the yearly share price gain of 38% over the same period. So one could conclude that the broader market has become more cautious towards the stock. This cautious sentiment is reflected in its (fairly low) P/E ratio of 11.01.
The image below shows how EPS has tracked over time (if you click on the image you can see greater detail).
We know that Boise Cascade has improved its bottom line over the last three years, but what does the future have in store? You can see how its balance sheet has strengthened (or weakened) over time in this free interactive graphic.
What About Dividends?
As well as measuring the share price return, investors should also consider the total shareholder return (TSR). The TSR incorporates the value of any spin-offs or discounted capital raisings, along with any dividends, based on the assumption that the dividends are reinvested. It's fair to say that the TSR gives a more complete picture for stocks that pay a dividend. We note that for Boise Cascade the TSR over the last 5 years was 589%, which is better than the share price return mentioned above. This is largely a result of its dividend payments!
A Different Perspective
It's nice to see that Boise Cascade shareholders have received a total shareholder return of 118% over the last year. And that does include the dividend. That's better than the annualised return of 47% over half a decade, implying that the company is doing better recently. Someone with an optimistic perspective could view the recent improvement in TSR as indicating that the business itself is getting better with time. While it is well worth considering the different impacts that market conditions can have on the share price, there are other factors that are even more important. Consider for instance, the ever-present spectre of investment risk. We've identified 3 warning signs with Boise Cascade , and understanding them should be part of your investment process.
We will like Boise Cascade better if we see some big insider buys. While we wait, check out this free list of growing companies with considerable, recent, insider buying.
Please note, the market returns quoted in this article reflect the market weighted average returns of stocks that currently trade on American exchanges.
Valuation is complex, but we're helping make it simple.
Find out whether Boise Cascade is potentially over or undervalued by checking out our comprehensive analysis, which includes fair value estimates, risks and warnings, dividends, insider transactions and financial health.
View the Free AnalysisHave feedback on this article? Concerned about the content? Get in touch with us directly. Alternatively, email editorial-team (at) simplywallst.com.
This article by Simply Wall St is general in nature. We provide commentary based on historical data and analyst forecasts only using an unbiased methodology and our articles are not intended to be financial advice. It does not constitute a recommendation to buy or sell any stock, and does not take account of your objectives, or your financial situation. We aim to bring you long-term focused analysis driven by fundamental data. Note that our analysis may not factor in the latest price-sensitive company announcements or qualitative material. Simply Wall St has no position in any stocks mentioned.
About NYSE:BCC
Boise Cascade
Boise Cascade Company engages in manufacture of wood products and distribution of building materials in the United States and Canada.
Flawless balance sheet, good value and pays a dividend.
