Advertisement
- United States
- /
- Construction
- /
- NYSE:ACM
Is Now the Right Time to Reassess AECOM After Leadership Changes and a 2.6% Price Dip?

Simply Wall St
Reviewed by Bailey Pemberton
- Wondering if AECOM is a hidden gem or just fairly priced? You are not alone, especially with so much chatter about the company's real value these days.
- After surging 22.4% so far this year and a whopping 183.6% over five years, AECOM's stock price has been on quite a ride. However, it dipped a modest 2.6% this week.
- In the past month, headlines have centered on AECOM’s pursuit of major infrastructure contracts and recent leadership shifts, sparking renewed interest from both institutional investors and analysts. Momentum from these updates is often a catalyst for price changes, making now a fascinating time to assess its valuation.
- On a straightforward scorecard, AECOM currently scores 2 out of 6 for being undervalued across our key checks, but classic valuation models only tell part of the story. Stay tuned for a unique take on what could really move the needle for AECOM's value.
AECOM scores just 2/6 on our valuation checks. See what other red flags we found in the full valuation breakdown.
Approach 1: AECOM Discounted Cash Flow (DCF) Analysis
The Discounted Cash Flow (DCF) model aims to estimate a company's value by projecting its future cash flows and then discounting them back to their present value. For AECOM, this approach uses cash flow forecasts, reflecting both analyst estimates for the next few years and longer-term growth assumptions extrapolated by financial models.
AECOM’s latest reported Free Cash Flow stands at $795.9 Million. According to the available data, analysts expect the company’s cash flows to gradually increase over the coming years, with projections reaching $823.1 Million by 2027. Beyond this point, the model extrapolates future growth and estimates approximately $1.02 Billion in Free Cash Flow by 2035.
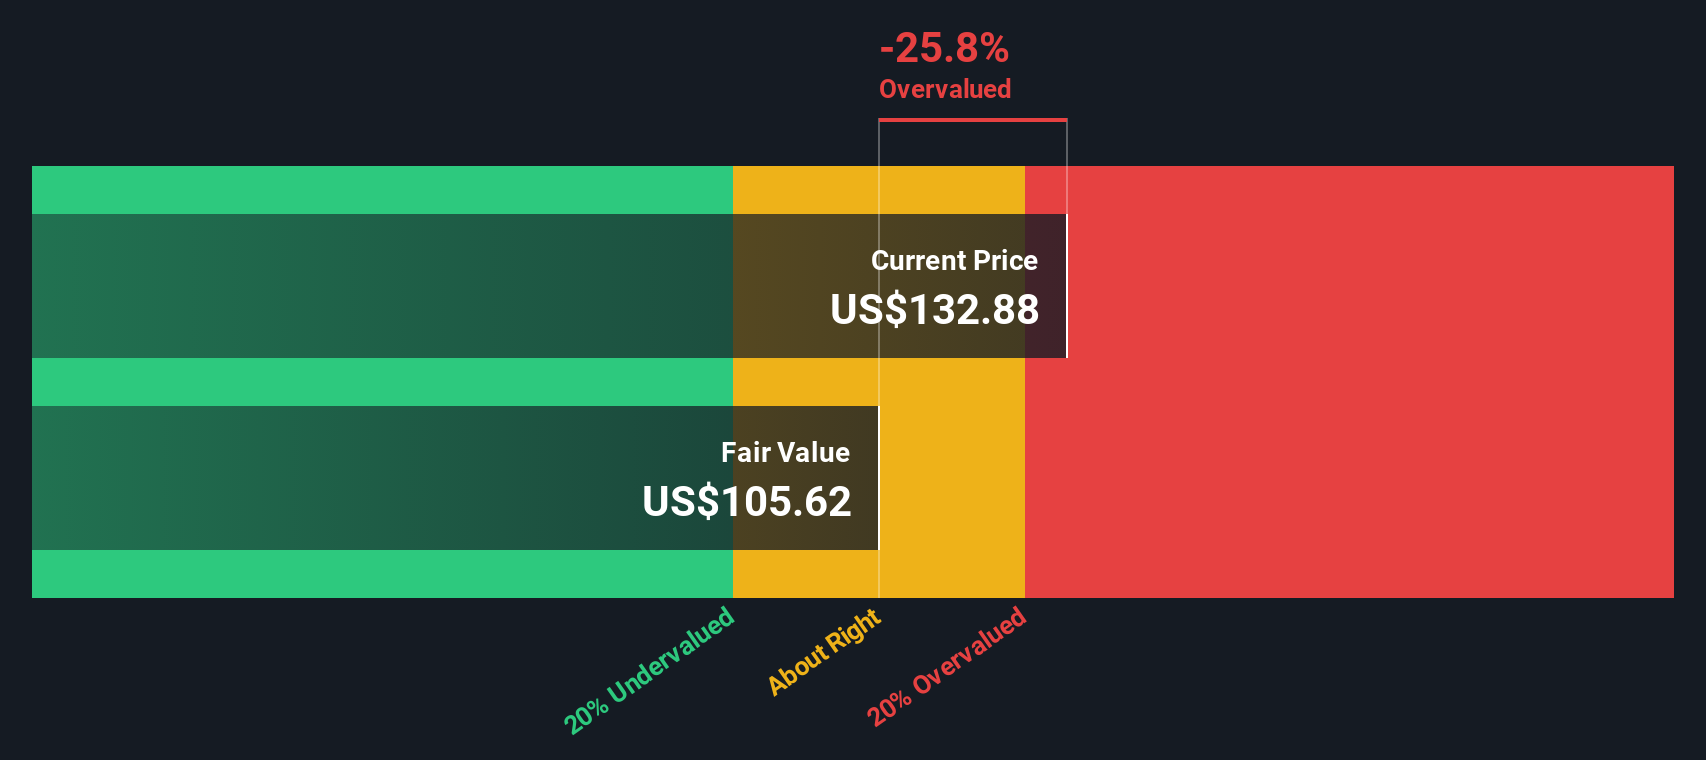
Based on these projections and using the two-stage Free Cash Flow to Equity model, the estimated intrinsic value of AECOM stock comes out to $102.91 per share. However, this DCF valuation currently implies the stock is about 26.5% overvalued compared to its recent market price.
Result: OVERVALUED
Our Discounted Cash Flow (DCF) analysis suggests AECOM may be overvalued by 26.5%. Discover 861 undervalued stocks or create your own screener to find better value opportunities.
Approach 2: AECOM Price vs Earnings
The Price-to-Earnings (PE) ratio is a popular valuation metric for profitable companies like AECOM, as it reflects what investors are willing to pay for each dollar of earnings. This metric works best for firms with stable profits, since it provides a direct link between stock price and actual earnings power.
A "normal" or "fair" PE ratio is influenced by expectations about a company’s future growth and the perceived risk in achieving that growth. Higher anticipated growth or lower risk typically justifies a higher PE, while slower growth or elevated risk leads to a lower ratio being viewed as fair.
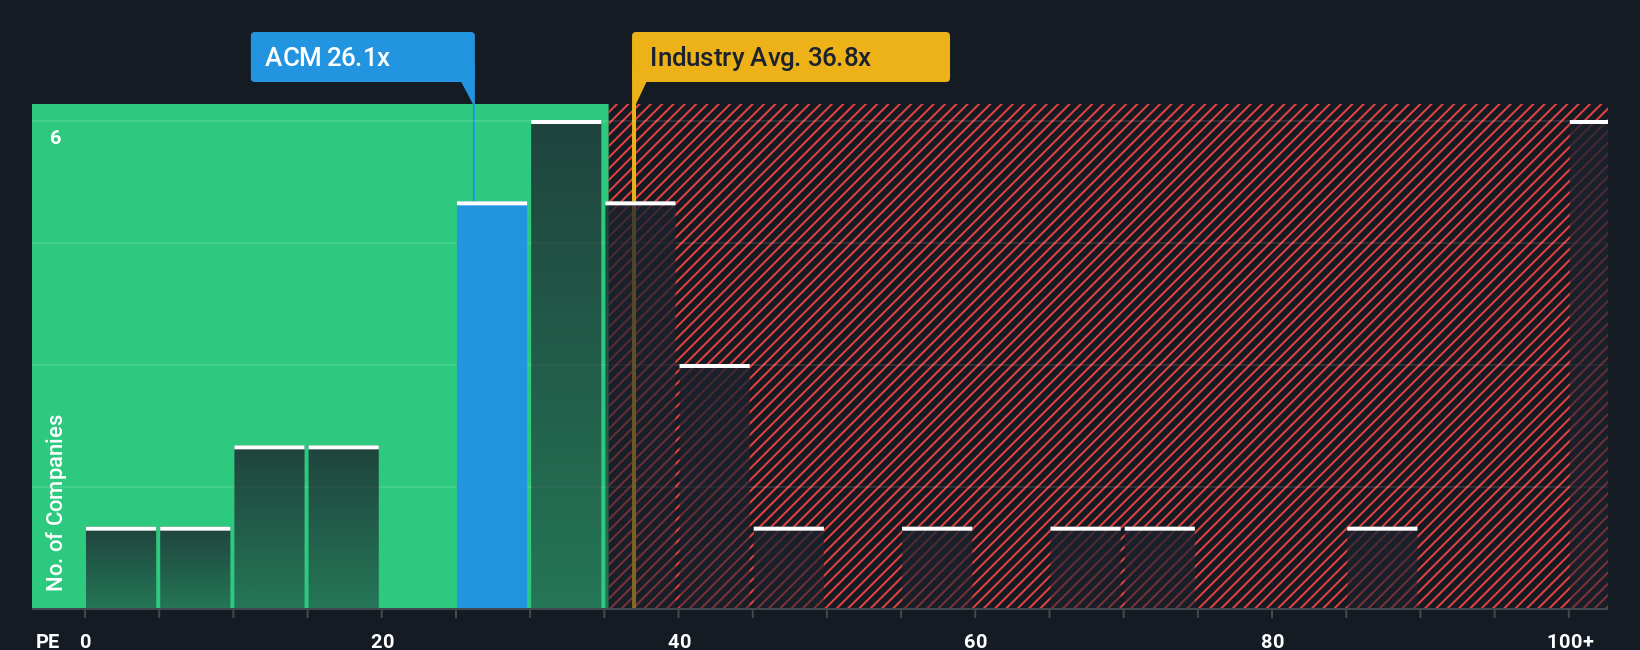
AECOM’s current PE ratio stands at 25x. This is lower than the industry average of 33.5x and significantly below the peer average of 51.5x. However, raw comparisons like these do not capture the full story, since factors such as profit margins, risk profile, and company size also influence what a fair multiple should be.
This is where Simply Wall St's proprietary “Fair Ratio” stands out. The Fair Ratio is a more nuanced metric that considers earnings growth, profitability, market cap, industry context and risk factors unique to AECOM. As a result, it gives a more tailored benchmark than industry or peer averages, avoiding one-size-fits-all pitfalls.
With AECOM’s Fair Ratio calculated at 23.8x, which is within 1x of its current 25x multiple, the shares appear to be priced just about right according to this approach.
Result: ABOUT RIGHT
PE ratios tell one story, but what if the real opportunity lies elsewhere? Discover 1407 companies where insiders are betting big on explosive growth.
Upgrade Your Decision Making: Choose your AECOM Narrative
Earlier we mentioned that there's an even better way to understand valuation, so let's introduce you to Narratives. A Narrative is a powerful tool that lets you craft your own story about a company by tying your assumptions about future revenue, earnings, margins, and risks to a forecast and a resulting fair value estimate. Rather than just relying on numbers, Narratives allow you to express your perspective about AECOM, linking the company’s business story to real financial forecasts and fair value calculations.
Narratives make investment decision-making more dynamic and personal by making it easy to compare your fair value to the current share price and decide when to buy or sell based on your outlook. On Simply Wall St's platform, millions of investors share and update their Narratives within the Community page, making it an accessible and collaborative way to invest. Each Narrative is automatically refreshed as news, earnings, or company events come in to ensure your view of fair value always reflects the latest data.
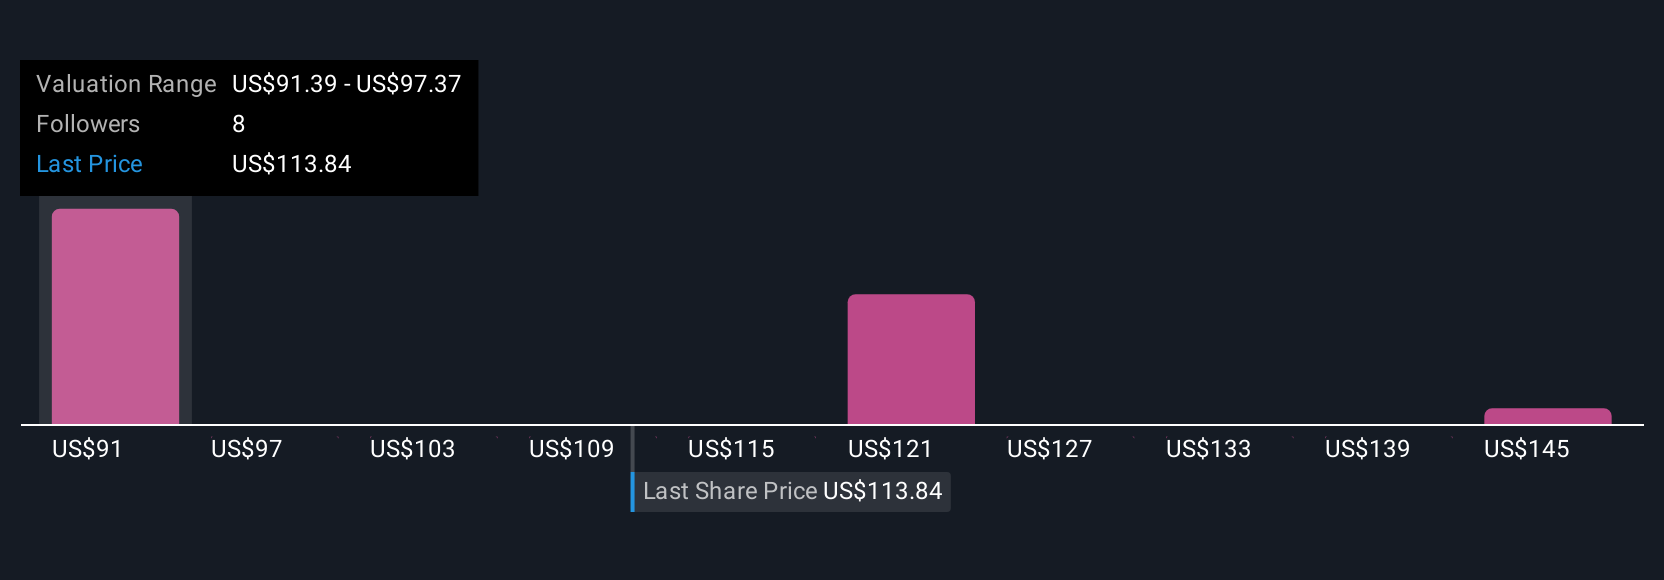
For example, some investors have built bullish Narratives around AECOM, pointing to opportunities from record project backlogs and government-backed infrastructure spending, resulting in fair value estimates as high as $145.0. Others remain cautious due to risks like cost pressures and competition, arriving at much lower valuations with the most bearish Narrative pricing AECOM at just $109.0 per share. This range neatly illustrates how Narratives empower investors to align investment choices with their own stories and expectations.
Do you think there's more to the story for AECOM? Head over to our Community to see what others are saying!
This article by Simply Wall St is general in nature. We provide commentary based on historical data and analyst forecasts only using an unbiased methodology and our articles are not intended to be financial advice. It does not constitute a recommendation to buy or sell any stock, and does not take account of your objectives, or your financial situation. We aim to bring you long-term focused analysis driven by fundamental data. Note that our analysis may not factor in the latest price-sensitive company announcements or qualitative material. Simply Wall St has no position in any stocks mentioned.
New: Manage All Your Stock Portfolios in One Place
We've created the ultimate portfolio companion for stock investors, and it's free.
• Connect an unlimited number of Portfolios and see your total in one currency
• Be alerted to new Warning Signs or Risks via email or mobile
• Track the Fair Value of your stocks
Have feedback on this article? Concerned about the content? Get in touch with us directly. Alternatively, email editorial-team@simplywallst.com
About NYSE:ACM
AECOM
Provides professional infrastructure consulting services for governments, businesses, and organizations worldwide.
Outstanding track record with excellent balance sheet.
Similar Companies
Market Insights

Advertisement
Community Narratives
The company that turned a verb into a global necessity and basically runs the modern internet, digital ads, smartphones, maps, and AI.
Fair Value US$300.00|5.1% undervalued
OS
Community Contributor
Flowers Foods Pays A Fair Price For Health
Fair Value US$16.12|27.7% undervalued
NV
Community Contributor
TMX Group will thrive with 33.3% profit margin and enduring market moat
Fair Value CA$49.90|0.2% overvalued
LI
Community Contributor
The "Molecular Pencil": Why Beam's Technology is Built to Win
Fair Value US$65.01|64.4% undervalued
DA
Community Contributor