- United States
- /
- Electrical
- /
- NasdaqGS:POWL
Powell Industries (NASDAQ:POWL) stock performs better than its underlying earnings growth over last three years


Powell Industries, Inc. (NASDAQ:POWL) shareholders might be concerned after seeing the share price drop 12% in the last quarter. But that doesn't displace its brilliant performance over three years. In fact, the share price has taken off in that time, up 607%. Arguably, the recent fall is to be expected after such a strong rise. Only time will tell if there is still too much optimism currently reflected in the share price. We love happy stories like this one. The company should be really proud of that performance!
The past week has proven to be lucrative for Powell Industries investors, so let's see if fundamentals drove the company's three-year performance.
View our latest analysis for Powell Industries
To paraphrase Benjamin Graham: Over the short term the market is a voting machine, but over the long term it's a weighing machine. One way to examine how market sentiment has changed over time is to look at the interaction between a company's share price and its earnings per share (EPS).
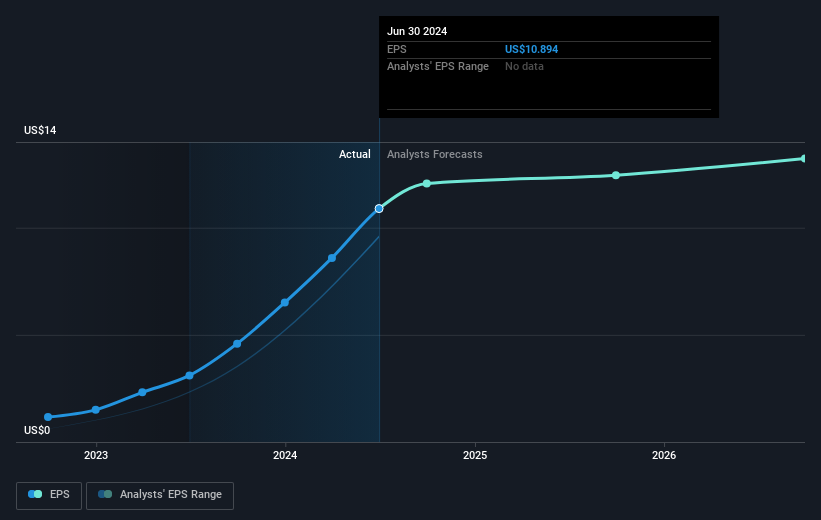
During three years of share price growth, Powell Industries achieved compound earnings per share growth of 610% per year. This EPS growth is higher than the 92% average annual increase in the share price. So it seems investors have become more cautious about the company, over time.
You can see how EPS has changed over time in the image below (click on the chart to see the exact values).
It's probably worth noting that the CEO is paid less than the median at similar sized companies. It's always worth keeping an eye on CEO pay, but a more important question is whether the company will grow earnings throughout the years. Dive deeper into the earnings by checking this interactive graph of Powell Industries' earnings, revenue and cash flow.
What About Dividends?
When looking at investment returns, it is important to consider the difference between total shareholder return (TSR) and share price return. The TSR incorporates the value of any spin-offs or discounted capital raisings, along with any dividends, based on the assumption that the dividends are reinvested. Arguably, the TSR gives a more comprehensive picture of the return generated by a stock. In the case of Powell Industries, it has a TSR of 661% for the last 3 years. That exceeds its share price return that we previously mentioned. And there's no prize for guessing that the dividend payments largely explain the divergence!
A Different Perspective
It's nice to see that Powell Industries shareholders have received a total shareholder return of 124% over the last year. And that does include the dividend. Since the one-year TSR is better than the five-year TSR (the latter coming in at 41% per year), it would seem that the stock's performance has improved in recent times. Someone with an optimistic perspective could view the recent improvement in TSR as indicating that the business itself is getting better with time. I find it very interesting to look at share price over the long term as a proxy for business performance. But to truly gain insight, we need to consider other information, too. To that end, you should be aware of the 2 warning signs we've spotted with Powell Industries .
If you would prefer to check out another company -- one with potentially superior financials -- then do not miss this free list of companies that have proven they can grow earnings.
Please note, the market returns quoted in this article reflect the market weighted average returns of stocks that currently trade on American exchanges.
New: Manage All Your Stock Portfolios in One Place
We've created the ultimate portfolio companion for stock investors, and it's free.
• Connect an unlimited number of Portfolios and see your total in one currency
• Be alerted to new Warning Signs or Risks via email or mobile
• Track the Fair Value of your stocks
Have feedback on this article? Concerned about the content? Get in touch with us directly. Alternatively, email editorial-team (at) simplywallst.com.
This article by Simply Wall St is general in nature. We provide commentary based on historical data and analyst forecasts only using an unbiased methodology and our articles are not intended to be financial advice. It does not constitute a recommendation to buy or sell any stock, and does not take account of your objectives, or your financial situation. We aim to bring you long-term focused analysis driven by fundamental data. Note that our analysis may not factor in the latest price-sensitive company announcements or qualitative material. Simply Wall St has no position in any stocks mentioned.
About NasdaqGS:POWL
Powell Industries
Designs, develops, manufactures, sells, and services custom-engineered equipment and systems.
Outstanding track record with flawless balance sheet.
