Advertisement
- United States
- /
- Machinery
- /
- NasdaqGS:PCAR
Does PACCAR’s Stock Offer Value After Recent Supply Chain and EV Investment News?

Simply Wall St
Reviewed by Bailey Pemberton
- Curious if PACCAR stock is a good deal right now? Let’s break down whether there’s value hidden beneath the hood.
- PACCAR’s share price has moved up 2.6% in the last week and 2.3% over the past month, even though it remains down 2.6% year-to-date and 9.6% over the past year. Long-term holders have still seen strong gains of over 100% in five years.
- Recent news around PACCAR includes supply chain updates and continued investments in electric vehicle development, both drawing attention from investors. These headlines have been a key backdrop for the stock’s recent price action and shifts in sentiment.
- PACCAR scores a 5 out of 6 on our valuation checklist, which is a strong result. We’ll unpack how this score is calculated across the classic approaches, then reveal a smarter way to understand PACCAR’s value at the end of this article.
Find out why PACCAR's -9.6% return over the last year is lagging behind its peers.
Approach 1: PACCAR Discounted Cash Flow (DCF) Analysis
The Discounted Cash Flow (DCF) model works by projecting a company’s future cash flows and then discounting those amounts back to today, to estimate what the business is really worth on a per-share basis. It is a popular way to gauge a company’s intrinsic value, especially for firms with steady and predictable cash generation.
For PACCAR, the current Free Cash Flow (FCF) stands at $3.4 Billion. Analysts forecast that PACCAR’s annual FCF will continue to grow, reaching $4.6 Billion by 2029. Beyond that, projections use conservative estimations, with Simply Wall St extending the outlook on a gradual growth path over ten years, ultimately surpassing $6.2 Billion by 2035.
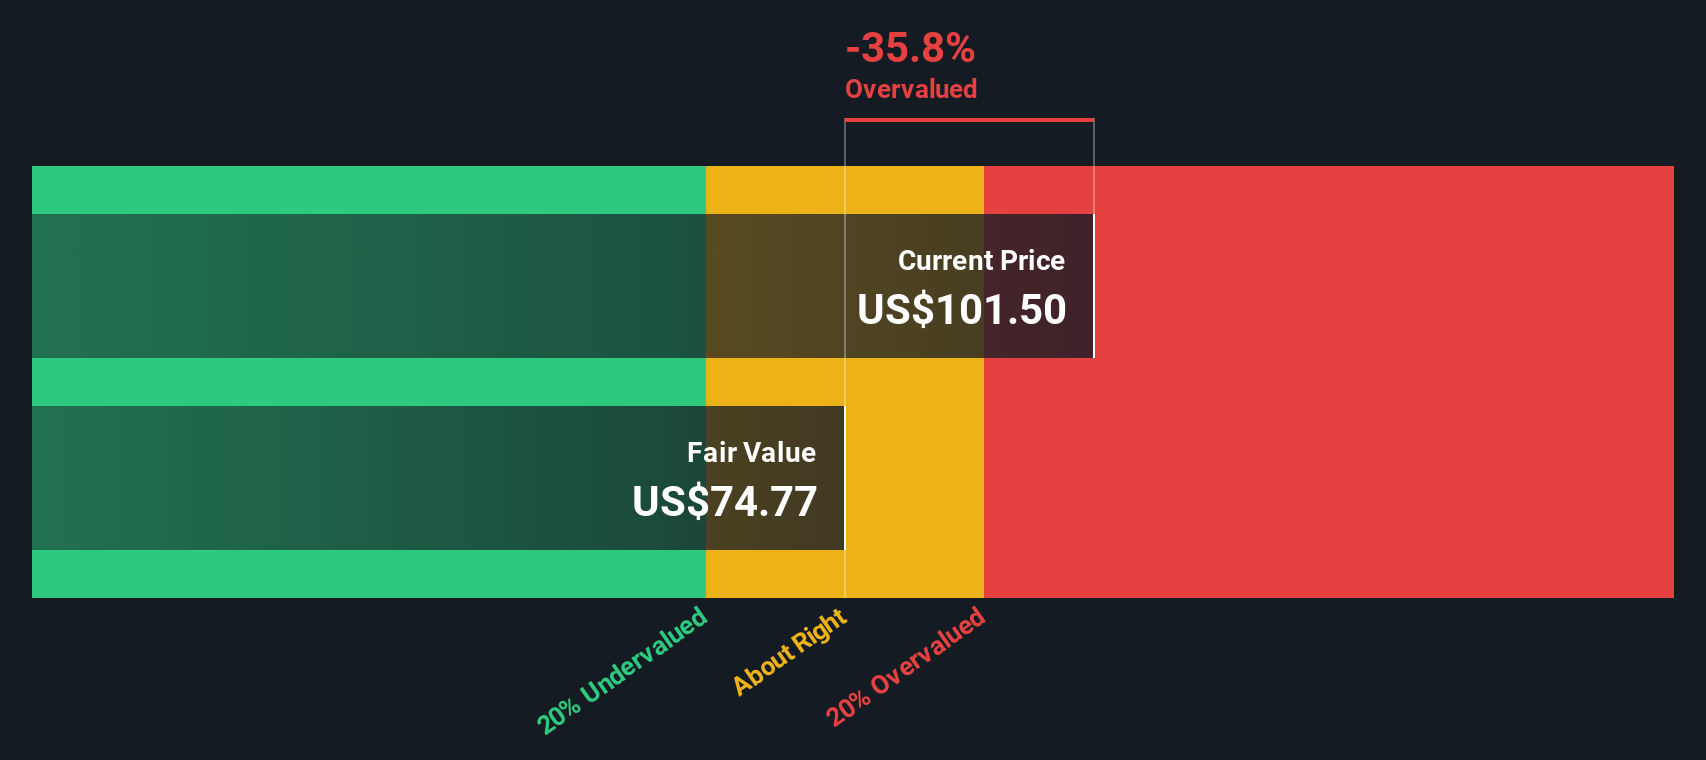
Based on these projections and the 2 Stage Free Cash Flow to Equity model, the DCF calculation arrives at a fair value of $146.10 per share. When compared to the current share price, this model suggests that PACCAR is trading at a 31.0% discount. In other words, the stock appears significantly undervalued by this measure.
Result: UNDERVALUED
Our Discounted Cash Flow (DCF) analysis suggests PACCAR is undervalued by 31.0%. Track this in your watchlist or portfolio, or discover 849 more undervalued stocks based on cash flows.
Approach 2: PACCAR Price vs Earnings
The Price-to-Earnings (PE) ratio is often the best valuation tool for profitable companies like PACCAR. This metric tells investors how much they are paying for each dollar of earnings, offering a simple snapshot of whether a stock appears cheap or expensive compared to its profits.
What counts as a “normal” or “fair” PE ratio isn’t set in stone. It varies depending on market expectations for future earnings growth and the perceived risk in a company’s business. Fast-growing, lower-risk businesses typically command higher PE ratios, while more mature or riskier companies tend to see lower multiples.
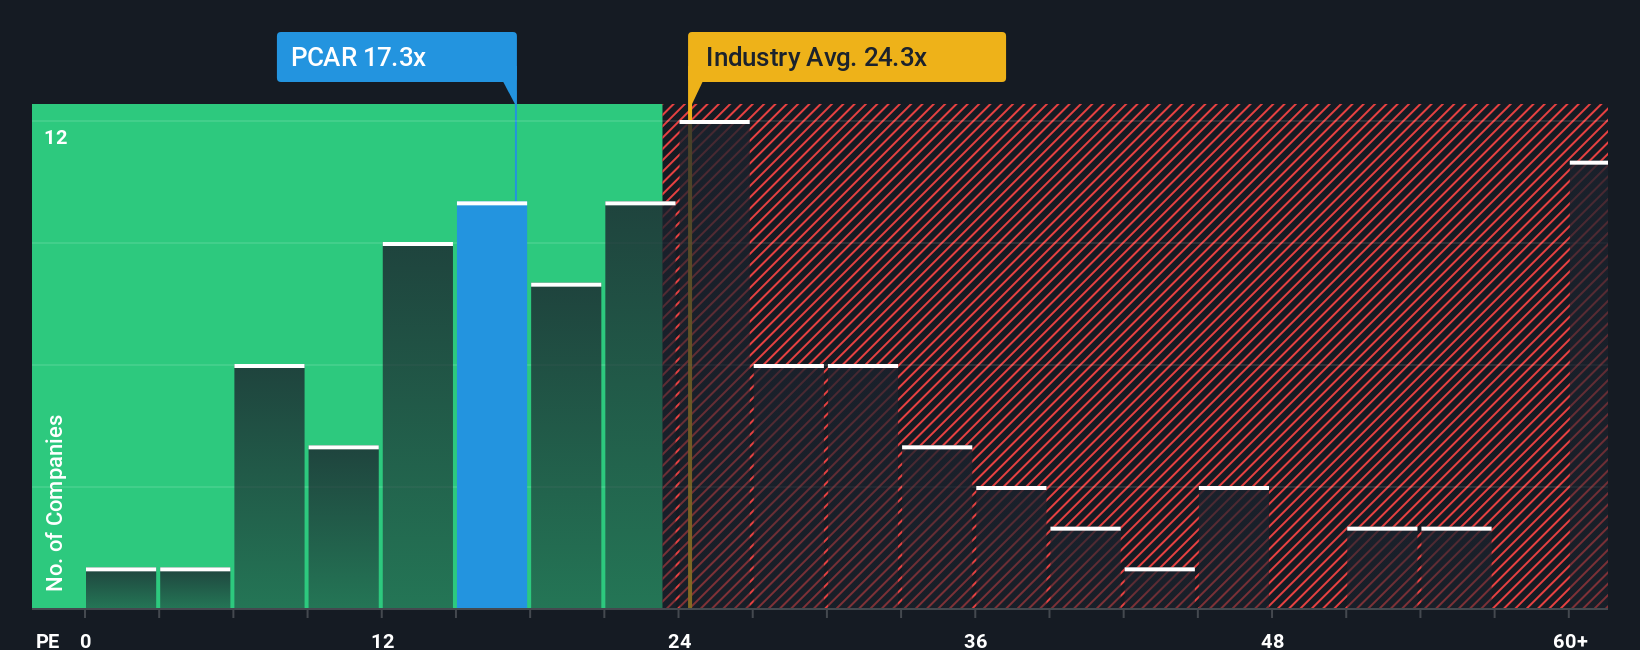
Right now, PACCAR trades at a PE ratio of 19.7x. That is below both the Machinery industry average of 23.95x and the peer average of 22.8x. On the surface, this might make PACCAR look like a bargain relative to its competitors.
Simply Wall St calculates its own “Fair Ratio” for PACCAR, which goes beyond surface-level comparisons to peers and industry averages. The Fair Ratio incorporates the company’s actual fundamentals, such as its earnings growth, profit margins, market cap, industry segment and underlying business risks, to provide a more nuanced perspective on value.
PACCAR’s Fair Ratio is 31.5x, which is significantly higher than both its current PE and the industry average. This suggests the market is currently pricing PACCAR below what would be justified by its solid earnings fundamentals and growth profile.
Result: UNDERVALUED
PE ratios tell one story, but what if the real opportunity lies elsewhere? Discover 1407 companies where insiders are betting big on explosive growth.
Upgrade Your Decision Making: Choose your PACCAR Narrative
Earlier we mentioned that there is an even better way to understand valuation, so let us introduce you to Narratives. Narratives are a unique, intuitive tool that empowers you to build your own “story” behind a company, connecting your personal assumptions about future revenue, earnings, and profit margins directly to a fair value estimate. Rather than relying only on models or consensus, you can factor in what you believe are PACCAR’s real business strengths, risks, and future potential.
A Narrative links the company’s story to a specific financial forecast, which then flows through to a calculated fair value. This allows you to clearly see the reasoning behind your investment thesis and compare it with those from other investors in the Simply Wall St Community, right on the Community page.
With Narratives, you can easily decide whether to buy or sell by seeing how your own fair value compares to the current market price. And because these Narratives update instantly as new news or earnings reports are released, your outlook always reflects the freshest data and sentiment.
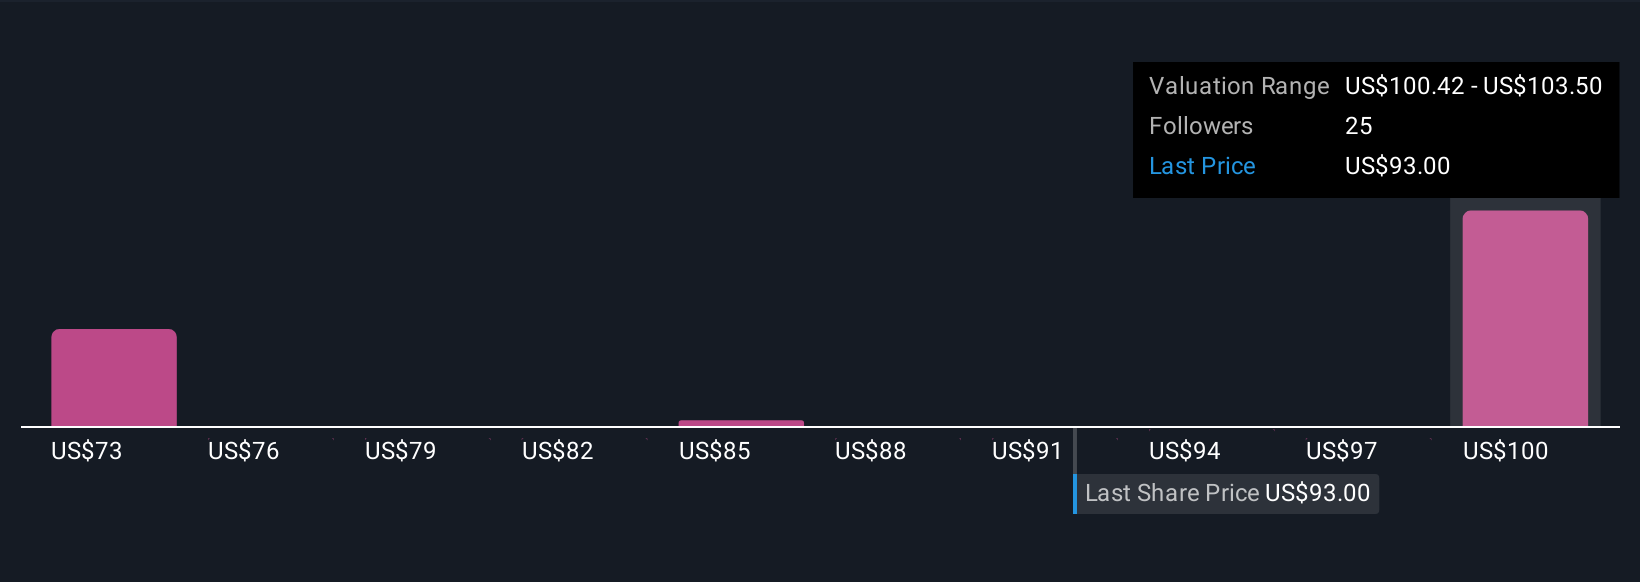
For PACCAR, some investors’ Narratives are bullish, anticipating margin expansion and tariff relief could push fair value as high as $131, while others are more cautious, highlighting regulatory and demand risks that suggest a fair value closer to $86.
Do you think there's more to the story for PACCAR? Head over to our Community to see what others are saying!
This article by Simply Wall St is general in nature. We provide commentary based on historical data and analyst forecasts only using an unbiased methodology and our articles are not intended to be financial advice. It does not constitute a recommendation to buy or sell any stock, and does not take account of your objectives, or your financial situation. We aim to bring you long-term focused analysis driven by fundamental data. Note that our analysis may not factor in the latest price-sensitive company announcements or qualitative material. Simply Wall St has no position in any stocks mentioned.
New: Manage All Your Stock Portfolios in One Place
We've created the ultimate portfolio companion for stock investors, and it's free.
• Connect an unlimited number of Portfolios and see your total in one currency
• Be alerted to new Warning Signs or Risks via email or mobile
• Track the Fair Value of your stocks
Have feedback on this article? Concerned about the content? Get in touch with us directly. Alternatively, email editorial-team@simplywallst.com
About NasdaqGS:PCAR
PACCAR
Designs, manufactures, and distributes light, medium, and heavy-duty commercial trucks in the United States, Canada, Europe, Mexico, South America, Australia, and internationally.
Flawless balance sheet, undervalued and pays a dividend.
Similar Companies
Market Insights

Advertisement
Community Narratives
The company that turned a verb into a global necessity and basically runs the modern internet, digital ads, smartphones, maps, and AI.
Fair Value US$300.00|5.1% undervalued
OS
Community Contributor
Flowers Foods Pays A Fair Price For Health
Fair Value US$16.12|27.7% undervalued
NV
Community Contributor
TMX Group will thrive with 33.3% profit margin and enduring market moat
Fair Value CA$49.90|0.2% overvalued
LI
Community Contributor
The "Molecular Pencil": Why Beam's Technology is Built to Win
Fair Value US$65.01|64.4% undervalued
DA
Community Contributor