Stock Analysis
- Taiwan
- /
- Electronic Equipment and Components
- /
- TWSE:6269
Flexium Interconnect's (TWSE:6269) earnings have declined over three years, contributing to shareholders 17% loss


In order to justify the effort of selecting individual stocks, it's worth striving to beat the returns from a market index fund. But the risk of stock picking is that you will likely buy under-performing companies. We regret to report that long term Flexium Interconnect, Inc. (TWSE:6269) shareholders have had that experience, with the share price dropping 29% in three years, versus a market return of about 51%. On the other hand the share price has bounced 9.7% over the last week. But this could be related to the strong market, with stocks up around 4.6% in the same time.
While the stock has risen 9.7% in the past week but long term shareholders are still in the red, let's see what the fundamentals can tell us.
See our latest analysis for Flexium Interconnect
To quote Buffett, 'Ships will sail around the world but the Flat Earth Society will flourish. There will continue to be wide discrepancies between price and value in the marketplace...' By comparing earnings per share (EPS) and share price changes over time, we can get a feel for how investor attitudes to a company have morphed over time.
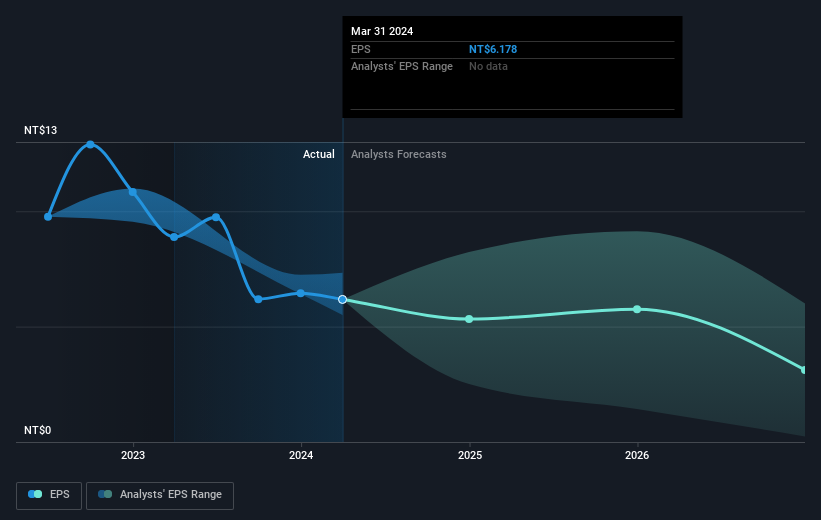
During the three years that the share price fell, Flexium Interconnect's earnings per share (EPS) dropped by 12% each year. This change in EPS is reasonably close to the 11% average annual decrease in the share price. So it seems like sentiment towards the stock hasn't changed all that much over time. In this case, it seems that the EPS is guiding the share price.
You can see below how EPS has changed over time (discover the exact values by clicking on the image).
Before buying or selling a stock, we always recommend a close examination of historic growth trends, available here.
What About Dividends?
It is important to consider the total shareholder return, as well as the share price return, for any given stock. The TSR is a return calculation that accounts for the value of cash dividends (assuming that any dividend received was reinvested) and the calculated value of any discounted capital raisings and spin-offs. So for companies that pay a generous dividend, the TSR is often a lot higher than the share price return. In the case of Flexium Interconnect, it has a TSR of -17% for the last 3 years. That exceeds its share price return that we previously mentioned. This is largely a result of its dividend payments!
A Different Perspective
Flexium Interconnect shareholders gained a total return of 9.4% during the year. But that return falls short of the market. The silver lining is that the gain was actually better than the average annual return of 8% per year over five year. This could indicate that the company is winning over new investors, as it pursues its strategy. I find it very interesting to look at share price over the long term as a proxy for business performance. But to truly gain insight, we need to consider other information, too. Consider risks, for instance. Every company has them, and we've spotted 1 warning sign for Flexium Interconnect you should know about.
Of course, you might find a fantastic investment by looking elsewhere. So take a peek at this free list of companies we expect will grow earnings.
Please note, the market returns quoted in this article reflect the market weighted average returns of stocks that currently trade on Taiwanese exchanges.
Valuation is complex, but we're helping make it simple.
Find out whether Flexium Interconnect is potentially over or undervalued by checking out our comprehensive analysis, which includes fair value estimates, risks and warnings, dividends, insider transactions and financial health.
View the Free AnalysisHave feedback on this article? Concerned about the content? Get in touch with us directly. Alternatively, email editorial-team (at) simplywallst.com.
This article by Simply Wall St is general in nature. We provide commentary based on historical data and analyst forecasts only using an unbiased methodology and our articles are not intended to be financial advice. It does not constitute a recommendation to buy or sell any stock, and does not take account of your objectives, or your financial situation. We aim to bring you long-term focused analysis driven by fundamental data. Note that our analysis may not factor in the latest price-sensitive company announcements or qualitative material. Simply Wall St has no position in any stocks mentioned.
Valuation is complex, but we're helping make it simple.
Find out whether Flexium Interconnect is potentially over or undervalued by checking out our comprehensive analysis, which includes fair value estimates, risks and warnings, dividends, insider transactions and financial health.
View the Free AnalysisHave feedback on this article? Concerned about the content? Get in touch with us directly. Alternatively, email editorial-team@simplywallst.com
About TWSE:6269
Flexium Interconnect
Engages in the design, development, manufacture, and sale of flexible printed circuit boards in Taiwan, China, rest of Asia, Europe, and the Americas.
6 star dividend payer with excellent balance sheet.
