- Taiwan
- /
- Electronic Equipment and Components
- /
- TWSE:3583
Is Scientech Corporation's (TWSE:3583) Latest Stock Performance A Reflection Of Its Financial Health?


Most readers would already be aware that Scientech's (TWSE:3583) stock increased significantly by 28% over the past three months. Since the market usually pay for a company’s long-term fundamentals, we decided to study the company’s key performance indicators to see if they could be influencing the market. Particularly, we will be paying attention to Scientech's ROE today.
Return on equity or ROE is an important factor to be considered by a shareholder because it tells them how effectively their capital is being reinvested. In short, ROE shows the profit each dollar generates with respect to its shareholder investments.
Check out our latest analysis for Scientech
How Is ROE Calculated?
Return on equity can be calculated by using the formula:
Return on Equity = Net Profit (from continuing operations) ÷ Shareholders' Equity
So, based on the above formula, the ROE for Scientech is:
18% = NT$715m ÷ NT$4.0b (Based on the trailing twelve months to March 2024).
The 'return' is the profit over the last twelve months. That means that for every NT$1 worth of shareholders' equity, the company generated NT$0.18 in profit.
Why Is ROE Important For Earnings Growth?
We have already established that ROE serves as an efficient profit-generating gauge for a company's future earnings. Depending on how much of these profits the company reinvests or "retains", and how effectively it does so, we are then able to assess a company’s earnings growth potential. Generally speaking, other things being equal, firms with a high return on equity and profit retention, have a higher growth rate than firms that don’t share these attributes.
A Side By Side comparison of Scientech's Earnings Growth And 18% ROE
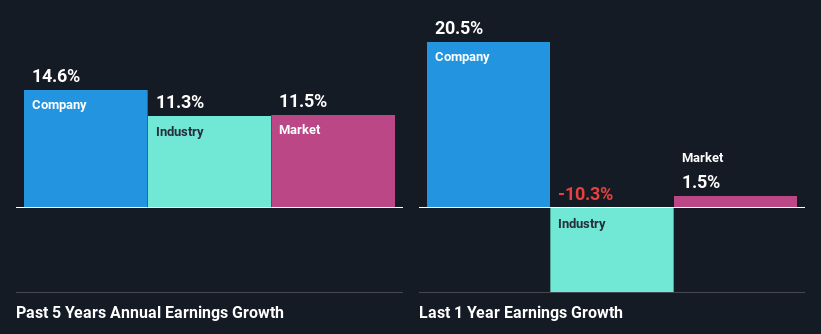
To begin with, Scientech seems to have a respectable ROE. On comparing with the average industry ROE of 8.5% the company's ROE looks pretty remarkable. This certainly adds some context to Scientech's decent 15% net income growth seen over the past five years.
As a next step, we compared Scientech's net income growth with the industry, and pleasingly, we found that the growth seen by the company is higher than the average industry growth of 11%.
Earnings growth is a huge factor in stock valuation. It’s important for an investor to know whether the market has priced in the company's expected earnings growth (or decline). This then helps them determine if the stock is placed for a bright or bleak future. One good indicator of expected earnings growth is the P/E ratio which determines the price the market is willing to pay for a stock based on its earnings prospects. So, you may want to check if Scientech is trading on a high P/E or a low P/E, relative to its industry.
Is Scientech Efficiently Re-investing Its Profits?
Scientech has a three-year median payout ratio of 46%, which implies that it retains the remaining 54% of its profits. This suggests that its dividend is well covered, and given the decent growth seen by the company, it looks like management is reinvesting its earnings efficiently.
Moreover, Scientech is determined to keep sharing its profits with shareholders which we infer from its long history of paying a dividend for at least ten years.
Summary
Overall, we are quite pleased with Scientech's performance. Particularly, we like that the company is reinvesting heavily into its business, and at a high rate of return. Unsurprisingly, this has led to an impressive earnings growth. If the company continues to grow its earnings the way it has, that could have a positive impact on its share price given how earnings per share influence long-term share prices. Not to forget, share price outcomes are also dependent on the potential risks a company may face. So it is important for investors to be aware of the risks involved in the business. You can see the 1 risk we have identified for Scientech by visiting our risks dashboard for free on our platform here.
New: Manage All Your Stock Portfolios in One Place
We've created the ultimate portfolio companion for stock investors, and it's free.
• Connect an unlimited number of Portfolios and see your total in one currency
• Be alerted to new Warning Signs or Risks via email or mobile
• Track the Fair Value of your stocks
Have feedback on this article? Concerned about the content? Get in touch with us directly. Alternatively, email editorial-team (at) simplywallst.com.
This article by Simply Wall St is general in nature. We provide commentary based on historical data and analyst forecasts only using an unbiased methodology and our articles are not intended to be financial advice. It does not constitute a recommendation to buy or sell any stock, and does not take account of your objectives, or your financial situation. We aim to bring you long-term focused analysis driven by fundamental data. Note that our analysis may not factor in the latest price-sensitive company announcements or qualitative material. Simply Wall St has no position in any stocks mentioned.
About TWSE:3583
Scientech
Engages in the research and development, production, sale, and maintenance of process equipment for semiconductors, liquid crystal displays (LCDs), light-emitting diodes (LEDs), and solar power generation industries.
Excellent balance sheet with proven track record.
