
Advertisement
- Taiwan
- /
- Tech Hardware
- /
- TWSE:2397
DFI Inc. (TWSE:2397) Stock's On A Decline: Are Poor Fundamentals The Cause?
DFI (TWSE:2397) has had a rough week with its share price down 10%. To decide if this trend could continue, we decided to look at its weak fundamentals as they shape the long-term market trends. Specifically, we decided to study DFI's ROE in this article.
ROE or return on equity is a useful tool to assess how effectively a company can generate returns on the investment it received from its shareholders. In other words, it is a profitability ratio which measures the rate of return on the capital provided by the company's shareholders.
See our latest analysis for DFI
How To Calculate Return On Equity?
Return on equity can be calculated by using the formula:
Return on Equity = Net Profit (from continuing operations) ÷ Shareholders' Equity
So, based on the above formula, the ROE for DFI is:
6.1% = NT$287m ÷ NT$4.7b (Based on the trailing twelve months to March 2024).
The 'return' refers to a company's earnings over the last year. One way to conceptualize this is that for each NT$1 of shareholders' capital it has, the company made NT$0.06 in profit.
Why Is ROE Important For Earnings Growth?
Thus far, we have learned that ROE measures how efficiently a company is generating its profits. Based on how much of its profits the company chooses to reinvest or "retain", we are then able to evaluate a company's future ability to generate profits. Generally speaking, other things being equal, firms with a high return on equity and profit retention, have a higher growth rate than firms that don’t share these attributes.
A Side By Side comparison of DFI's Earnings Growth And 6.1% ROE
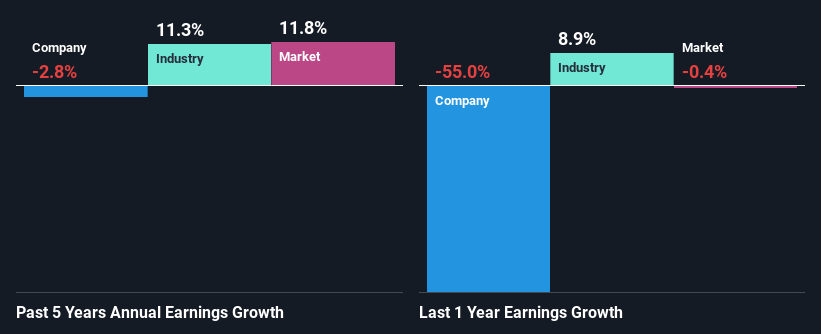
When you first look at it, DFI's ROE doesn't look that attractive. We then compared the company's ROE to the broader industry and were disappointed to see that the ROE is lower than the industry average of 13%. Therefore, it might not be wrong to say that the five year net income decline of 2.8% seen by DFI was probably the result of it having a lower ROE. However, there could also be other factors causing the earnings to decline. For example, it is possible that the business has allocated capital poorly or that the company has a very high payout ratio.
However, when we compared DFI's growth with the industry we found that while the company's earnings have been shrinking, the industry has seen an earnings growth of 11% in the same period. This is quite worrisome.
The basis for attaching value to a company is, to a great extent, tied to its earnings growth. It’s important for an investor to know whether the market has priced in the company's expected earnings growth (or decline). Doing so will help them establish if the stock's future looks promising or ominous. If you're wondering about DFI's's valuation, check out this gauge of its price-to-earnings ratio, as compared to its industry.
Is DFI Efficiently Re-investing Its Profits?
DFI's declining earnings is not surprising given how the company is spending most of its profits in paying dividends, judging by its three-year median payout ratio of 75% (or a retention ratio of 25%). With only a little being reinvested into the business, earnings growth would obviously be low or non-existent. To know the 4 risks we have identified for DFI visit our risks dashboard for free.
In addition, DFI has been paying dividends over a period of at least ten years suggesting that keeping up dividend payments is way more important to the management even if it comes at the cost of business growth.
Conclusion
On the whole, DFI's performance is quite a big let-down. Because the company is not reinvesting much into the business, and given the low ROE, it's not surprising to see the lack or absence of growth in its earnings. Up till now, we've only made a short study of the company's growth data. To gain further insights into DFI's past profit growth, check out this visualization of past earnings, revenue and cash flows.
New: Manage All Your Stock Portfolios in One Place
We've created the ultimate portfolio companion for stock investors, and it's free.
• Connect an unlimited number of Portfolios and see your total in one currency
• Be alerted to new Warning Signs or Risks via email or mobile
• Track the Fair Value of your stocks
Have feedback on this article? Concerned about the content? Get in touch with us directly. Alternatively, email editorial-team (at) simplywallst.com.
This article by Simply Wall St is general in nature. We provide commentary based on historical data and analyst forecasts only using an unbiased methodology and our articles are not intended to be financial advice. It does not constitute a recommendation to buy or sell any stock, and does not take account of your objectives, or your financial situation. We aim to bring you long-term focused analysis driven by fundamental data. Note that our analysis may not factor in the latest price-sensitive company announcements or qualitative material. Simply Wall St has no position in any stocks mentioned.
Have feedback on this article? Concerned about the content? Get in touch with us directly. Alternatively, email editorial-team@simplywallst.com
About TWSE:2397
DFI
Designs, manufactures, and sells board and system-level products for embedded applications worldwide.
Excellent balance sheet established dividend payer.
Market Insights

Advertisement
Community Narratives
The "Molecular Pencil": Why Beam's Technology is Built to Win
Fair Value US$65.01|66.7% undervalued
DA
Community Contributor
The silent giant behind virtually every advanced chip powering AI, smartphones, and modern infrastructure.
Fair Value US$310.00|4.8% undervalued
OS
Community Contributor
ADP Stock: Solid Fundamentals, But AI Investments Test Its Margin Resilience
Fair Value US$387.77|34.5% undervalued
YI
Community Contributor
MINISO's fair value is projected at 26.69 with an anticipated PE ratio shift of 20x
Fair Value US$26.69|18.6% undervalued
BE
Community Contributor