Advertisement
- Taiwan
- /
- Electronic Equipment and Components
- /
- TPEX:3128
Hi Sharp Electronics Co., Ltd. (GTSM:3128) Has Fared Decently But Fundamentals Look Uncertain: What Lies Ahead For The Stock?
Most readers would already know that Hi Sharp Electronics' (GTSM:3128) stock increased by 1.6% over the past week. However, the company's financials look a bit inconsistent and market outcomes are ultimately driven by long-term fundamentals, meaning that the stock could head in either direction. Specifically, we decided to study Hi Sharp Electronics' ROE in this article.
Return on equity or ROE is an important factor to be considered by a shareholder because it tells them how effectively their capital is being reinvested. In other words, it is a profitability ratio which measures the rate of return on the capital provided by the company's shareholders.
Check out our latest analysis for Hi Sharp Electronics
How Do You Calculate Return On Equity?
The formula for return on equity is:
Return on Equity = Net Profit (from continuing operations) ÷ Shareholders' Equity
So, based on the above formula, the ROE for Hi Sharp Electronics is:
4.3% = NT$25m ÷ NT$574m (Based on the trailing twelve months to September 2020).
The 'return' refers to a company's earnings over the last year. One way to conceptualize this is that for each NT$1 of shareholders' capital it has, the company made NT$0.04 in profit.
What Has ROE Got To Do With Earnings Growth?
Thus far, we have learned that ROE measures how efficiently a company is generating its profits. We now need to evaluate how much profit the company reinvests or "retains" for future growth which then gives us an idea about the growth potential of the company. Assuming everything else remains unchanged, the higher the ROE and profit retention, the higher the growth rate of a company compared to companies that don't necessarily bear these characteristics.
Hi Sharp Electronics' Earnings Growth And 4.3% ROE
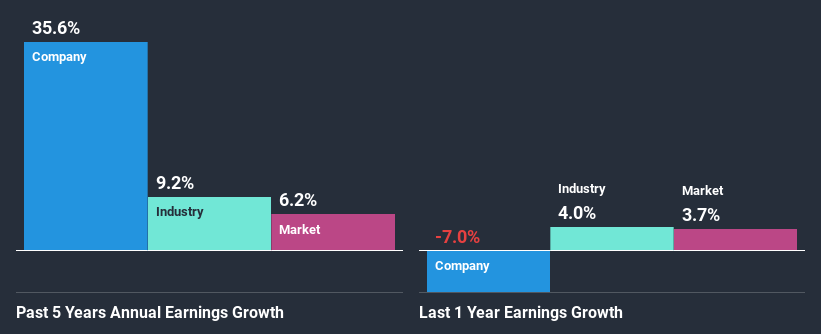
On the face of it, Hi Sharp Electronics' ROE is not much to talk about. A quick further study shows that the company's ROE doesn't compare favorably to the industry average of 9.9% either. Despite this, surprisingly, Hi Sharp Electronics saw an exceptional 36% net income growth over the past five years. So, there might be other aspects that are positively influencing the company's earnings growth. For instance, the company has a low payout ratio or is being managed efficiently.
As a next step, we compared Hi Sharp Electronics' net income growth with the industry, and pleasingly, we found that the growth seen by the company is higher than the average industry growth of 9.2%.
Earnings growth is a huge factor in stock valuation. What investors need to determine next is if the expected earnings growth, or the lack of it, is already built into the share price. This then helps them determine if the stock is placed for a bright or bleak future. If you're wondering about Hi Sharp Electronics''s valuation, check out this gauge of its price-to-earnings ratio, as compared to its industry.
Is Hi Sharp Electronics Efficiently Re-investing Its Profits?
The high three-year median payout ratio of 90% (implying that it keeps only 9.9% of profits) for Hi Sharp Electronics suggests that the company's growth wasn't really hampered despite it returning most of the earnings to its shareholders.
Moreover, Hi Sharp Electronics is determined to keep sharing its profits with shareholders which we infer from its long history of paying a dividend for at least ten years.
Summary
Overall, we have mixed feelings about Hi Sharp Electronics. Although the company has shown a pretty impressive growth in earnings, yet the low ROE and the low rate of reinvestment makes us skeptical about the continuity of that growth, especially when or if the business comes to face any threats. So far, we've only made a quick discussion around the company's earnings growth. You can do your own research on Hi Sharp Electronics and see how it has performed in the past by looking at this FREE detailed graph of past earnings, revenue and cash flows.
When trading Hi Sharp Electronics or any other investment, use the platform considered by many to be the Professional's Gateway to the Worlds Market, Interactive Brokers. You get the lowest-cost* trading on stocks, options, futures, forex, bonds and funds worldwide from a single integrated account. Promoted
Valuation is complex, but we're here to simplify it.
Discover if Hi Sharp Intelligence TechnologyLtd might be undervalued or overvalued with our detailed analysis, featuring fair value estimates, potential risks, dividends, insider trades, and its financial condition.
Access Free AnalysisThis article by Simply Wall St is general in nature. It does not constitute a recommendation to buy or sell any stock, and does not take account of your objectives, or your financial situation. We aim to bring you long-term focused analysis driven by fundamental data. Note that our analysis may not factor in the latest price-sensitive company announcements or qualitative material. Simply Wall St has no position in any stocks mentioned.
*Interactive Brokers Rated Lowest Cost Broker by StockBrokers.com Annual Online Review 2020
Have feedback on this article? Concerned about the content? Get in touch with us directly. Alternatively, email editorial-team@simplywallst.com.
About TPEX:3128
Hi Sharp Intelligence TechnologyLtd
Hi Sharp Intelligence Technology Co.,Ltd.
Mediocre balance sheet with low risk.
Market Insights


Advertisement
Weekly Picks
LO


Lou_Basenese on Optimi Health ·
The Only Psychedelic Company Already Selling MDMA and Psilocybin to Real Patients, Yet Priced Like It Doesn’t Exist
Fair Value:US$1157.5% undervalued
47 followersusers have followed this narrative
2 commentsusers have commented on this narrative
7 likesusers have liked this narrative
WE


WealthAP on Novo Nordisk ·
Novo Nordisk (NVO): Is the "Easy Growth" Story Over?
Fair Value:DKK 407.7721.4% undervalued
67 followersusers have followed this narrative
0 commentsusers have commented on this narrative
8 likesusers have liked this narrative
VA


ValueInvestingSubstack on Zoetis ·
Zoetis down -50% over the past year
Fair Value:US$92.9218.9% undervalued
23 followersusers have followed this narrative
0 commentsusers have commented on this narrative
9 likesusers have liked this narrative
CE


CentryResearch on Centrus Energy ·
Centrus Energy: The Next Nuclear Bottleneck Isn't Reactors. It's Fuel.
Fair Value:US$19013.7% undervalued
24 followersusers have followed this narrative
0 commentsusers have commented on this narrative
10 likesusers have liked this narrative
Recently Updated Narratives
WI

WisetoWealth on PayPal Holdings ·
The Underrated Transformation of a Digital Payments Giant
Fair Value:US$90.3137.8% undervalued
2 followersusers have followed this narrative
0 commentsusers have commented on this narrative
0 likesusers have liked this narrative
BL


Blagget on Terra Balcanica Resources ·
The C$4M Explorer Positioned to Become Europe's First Antimony Mine
Fair Value:CA$0.487.5% undervalued
2 followersusers have followed this narrative
0 commentsusers have commented on this narrative
0 likesusers have liked this narrative
DA

david_6nroa on Charter Communications ·
Charter is undervalued - Here's why.
Fair Value:US$87.0741.6% overvalued
1 followerusers have followed this narrative
0 commentsusers have commented on this narrative
0 likesusers have liked this narrative
Popular Narratives
CU

CubanEros on Microsoft ·
A wonderful business at reasonable price.
Fair Value:US$419.919.1% undervalued
81 followersusers have followed this narrative
0 commentsusers have commented on this narrative
6 likesusers have liked this narrative
OS


oscargarcia on NVIDIA ·
The company that went from selling GPUs to gamers to becoming the AI arms dealer of the 21st century.
Fair Value:US$28026.1% undervalued
185 followersusers have followed this narrative
9 commentsusers have commented on this narrative
15 likesusers have liked this narrative
BE
benjamin_lvieq on PayPal Holdings ·
PayPal: PayPal Doesn't Need to Grow – It Needs to Stop Falling – A Mispriced Cash Machine With a Cannibal Buyback
Fair Value:US$6513.6% undervalued
71 followersusers have followed this narrative
2 commentsusers have commented on this narrative
11 likesusers have liked this narrative
Trending Discussion
DE

derek_3wsdg on Teladoc Health ·
You’ve overlooked the activist investor factor. Travis Cocke’s Voss has announced 5% ownership through a 13G filing. They’ve added to that 5% since, and in doing so, have created a structural trap door for 27.42 Million Shares actively sold short. Chuck will announce lots of positives on July 29 but it’s what Voss announces shortly after that will rock the overextended Teledoc shorts. The Walmart partnership is the tip of the iceberg. The market is missing the sheer regulatory and enterprise friction of modern corporate healthcare. Teladoc isn't a "consumer app"; it is the primary digital infrastructure integrated directly into the legacy backends of Tier-1 insurance companies and fortune 500 employers, covering 105 million+ lives. Teladoc is acting as the digital top-of-funnel engine for the world's largest retailer. If Voss pushes the narrative that Teladoc is effectively the outsourced digital brain of Walmart's entire healthcare footprint, the fair value shifts from a basic health multiple to an enterprise distribution premium. Additionally , we are in a structural gold rush for high-quality, legally compliant, longitudinal medical data to train vertical healthcare AI models. Large technology hyperscalers and pharmaceutical giants cannot simply scrape the internet for this; they need structured clinical inputs. Teladoc sits on one of the largest de-identified virtual medical datasets on earth. From the activist playbook , we’ll see Voss demand the immediate creation of a Data & Diagnostics Licensing Division, transforming a legacy liability into an incredibly high-margin, pure-software data asset that requires zero human clinician hours to scale. Chuck is doing great work and deserves credi5 for the Teledoc turnaround but it will be Travis Cocke who will be responsible for a share price way beyond your $15 valuation.
1
|0

