- Taiwan
- /
- Semiconductors
- /
- TWSE:5434
Is Topco Scientific Co.,Ltd.'s (TWSE:5434) Latest Stock Performance A Reflection Of Its Financial Health?


Topco ScientificLtd (TWSE:5434) has had a great run on the share market with its stock up by a significant 39% over the last three months. Given that the market rewards strong financials in the long-term, we wonder if that is the case in this instance. Specifically, we decided to study Topco ScientificLtd's ROE in this article.
Return on equity or ROE is a key measure used to assess how efficiently a company's management is utilizing the company's capital. In short, ROE shows the profit each dollar generates with respect to its shareholder investments.
See our latest analysis for Topco ScientificLtd
How Do You Calculate Return On Equity?
Return on equity can be calculated by using the formula:
Return on Equity = Net Profit (from continuing operations) ÷ Shareholders' Equity
So, based on the above formula, the ROE for Topco ScientificLtd is:
20% = NT$2.9b ÷ NT$15b (Based on the trailing twelve months to March 2024).
The 'return' is the amount earned after tax over the last twelve months. One way to conceptualize this is that for each NT$1 of shareholders' capital it has, the company made NT$0.20 in profit.
What Is The Relationship Between ROE And Earnings Growth?
So far, we've learned that ROE is a measure of a company's profitability. Based on how much of its profits the company chooses to reinvest or "retain", we are then able to evaluate a company's future ability to generate profits. Assuming everything else remains unchanged, the higher the ROE and profit retention, the higher the growth rate of a company compared to companies that don't necessarily bear these characteristics.
Topco ScientificLtd's Earnings Growth And 20% ROE
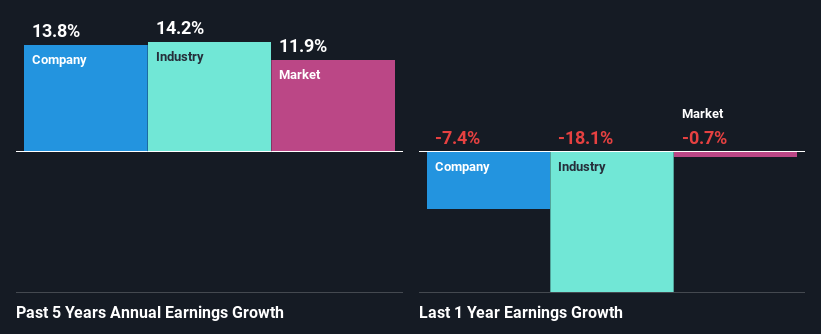
To start with, Topco ScientificLtd's ROE looks acceptable. Further, the company's ROE compares quite favorably to the industry average of 10%. Probably as a result of this, Topco ScientificLtd was able to see a decent growth of 14% over the last five years.
As a next step, we compared Topco ScientificLtd's net income growth with the industry and found that the company has a similar growth figure when compared with the industry average growth rate of 14% in the same period.
Earnings growth is an important metric to consider when valuing a stock. It’s important for an investor to know whether the market has priced in the company's expected earnings growth (or decline). By doing so, they will have an idea if the stock is headed into clear blue waters or if swampy waters await. Has the market priced in the future outlook for 5434? You can find out in our latest intrinsic value infographic research report.
Is Topco ScientificLtd Making Efficient Use Of Its Profits?
Topco ScientificLtd has a significant three-year median payout ratio of 63%, meaning that it is left with only 37% to reinvest into its business. This implies that the company has been able to achieve decent earnings growth despite returning most of its profits to shareholders.
Moreover, Topco ScientificLtd is determined to keep sharing its profits with shareholders which we infer from its long history of paying a dividend for at least ten years.
Conclusion
Overall, we are quite pleased with Topco ScientificLtd's performance. We are particularly impressed by the considerable earnings growth posted by the company, which was likely backed by its high ROE. While the company is paying out most of its earnings as dividends, it has been able to grow its earnings in spite of it, so that's probably a good sign. The latest industry analyst forecasts show that the company is expected to maintain its current growth rate. Are these analysts expectations based on the broad expectations for the industry, or on the company's fundamentals? Click here to be taken to our analyst's forecasts page for the company.
Valuation is complex, but we're here to simplify it.
Discover if Topco ScientificLtd might be undervalued or overvalued with our detailed analysis, featuring fair value estimates, potential risks, dividends, insider trades, and its financial condition.
Access Free AnalysisHave feedback on this article? Concerned about the content? Get in touch with us directly. Alternatively, email editorial-team (at) simplywallst.com.
This article by Simply Wall St is general in nature. We provide commentary based on historical data and analyst forecasts only using an unbiased methodology and our articles are not intended to be financial advice. It does not constitute a recommendation to buy or sell any stock, and does not take account of your objectives, or your financial situation. We aim to bring you long-term focused analysis driven by fundamental data. Note that our analysis may not factor in the latest price-sensitive company announcements or qualitative material. Simply Wall St has no position in any stocks mentioned.
About TWSE:5434
Topco ScientificLtd
Provides precision materials, manufacturing equipment, and components for semiconductor, LCD, and LED industries in Taiwan, China, and internationally.
Undervalued with excellent balance sheet and pays a dividend.

