- Taiwan
- /
- Real Estate
- /
- TWSE:1805
Better Life Group (TWSE:1805) delivers shareholders respectable 92% return over 1 year, surging 15% in the last week alone


These days it's easy to simply buy an index fund, and your returns should (roughly) match the market. But one can do better than that by picking better than average stocks (as part of a diversified portfolio). For example, the Better Life Group Co., LTD. (TWSE:1805) share price is up 82% in the last 1 year, clearly besting the market return of around 27% (not including dividends). If it can keep that out-performance up over the long term, investors will do very well! However, the stock hasn't done so well in the longer term, with the stock only up 7.9% in three years.
On the back of a solid 7-day performance, let's check what role the company's fundamentals have played in driving long term shareholder returns.
See our latest analysis for Better Life Group
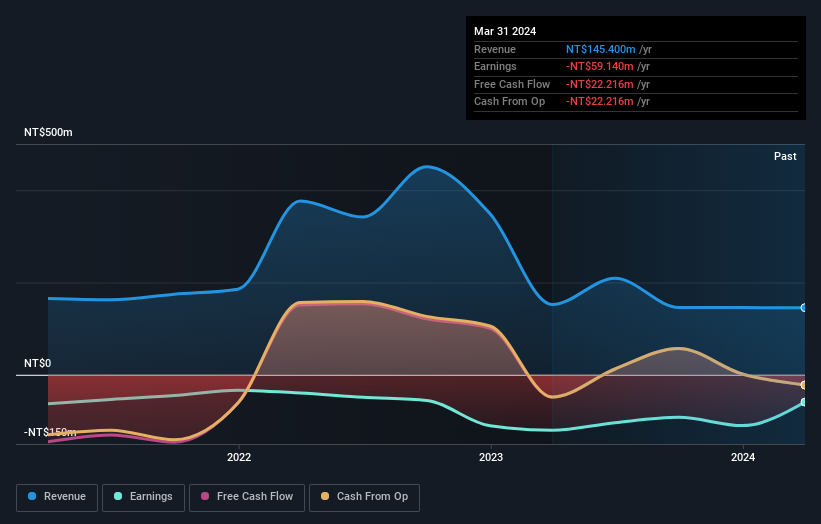
Better Life Group isn't currently profitable, so most analysts would look to revenue growth to get an idea of how fast the underlying business is growing. Generally speaking, companies without profits are expected to grow revenue every year, and at a good clip. That's because it's hard to be confident a company will be sustainable if revenue growth is negligible, and it never makes a profit.
Better Life Group actually shrunk its revenue over the last year, with a reduction of 4.4%. Despite the lack of revenue growth, the stock has returned a solid 82% the last twelve months. To us that means that there isn't a lot of correlation between the past revenue performance and the share price, but a closer look at analyst forecasts and the bottom line may well explain a lot.
You can see below how earnings and revenue have changed over time (discover the exact values by clicking on the image).
This free interactive report on Better Life Group's balance sheet strength is a great place to start, if you want to investigate the stock further.
What About The Total Shareholder Return (TSR)?
Investors should note that there's a difference between Better Life Group's total shareholder return (TSR) and its share price change, which we've covered above. Arguably the TSR is a more complete return calculation because it accounts for the value of dividends (as if they were reinvested), along with the hypothetical value of any discounted capital that have been offered to shareholders. Its history of dividend payouts mean that Better Life Group's TSR of 92% over the last 1 year is better than the share price return.
A Different Perspective
It's nice to see that Better Life Group shareholders have received a total shareholder return of 92% over the last year. Since the one-year TSR is better than the five-year TSR (the latter coming in at 13% per year), it would seem that the stock's performance has improved in recent times. Given the share price momentum remains strong, it might be worth taking a closer look at the stock, lest you miss an opportunity. While it is well worth considering the different impacts that market conditions can have on the share price, there are other factors that are even more important. Even so, be aware that Better Life Group is showing 3 warning signs in our investment analysis , and 1 of those makes us a bit uncomfortable...
But note: Better Life Group may not be the best stock to buy. So take a peek at this free list of interesting companies with past earnings growth (and further growth forecast).
Please note, the market returns quoted in this article reflect the market weighted average returns of stocks that currently trade on Taiwanese exchanges.
Valuation is complex, but we're here to simplify it.
Discover if Better Life Group might be undervalued or overvalued with our detailed analysis, featuring fair value estimates, potential risks, dividends, insider trades, and its financial condition.
Access Free AnalysisHave feedback on this article? Concerned about the content? Get in touch with us directly. Alternatively, email editorial-team (at) simplywallst.com.
This article by Simply Wall St is general in nature. We provide commentary based on historical data and analyst forecasts only using an unbiased methodology and our articles are not intended to be financial advice. It does not constitute a recommendation to buy or sell any stock, and does not take account of your objectives, or your financial situation. We aim to bring you long-term focused analysis driven by fundamental data. Note that our analysis may not factor in the latest price-sensitive company announcements or qualitative material. Simply Wall St has no position in any stocks mentioned.
Have feedback on this article? Concerned about the content? Get in touch with us directly. Alternatively, email editorial-team@simplywallst.com
About TWSE:1805
Better Life Group
Engages in the development, construction, letting, and sale of residential and other properties in Taiwan and China.
Flawless balance sheet low.
