DingZing Advanced Materials Inc.'s (TWSE:6585) Stock Has Been Sliding But Fundamentals Look Strong: Is The Market Wrong?


With its stock down 14% over the past month, it is easy to disregard DingZing Advanced Materials (TWSE:6585). But if you pay close attention, you might gather that its strong financials could mean that the stock could potentially see an increase in value in the long-term, given how markets usually reward companies with good financial health. In this article, we decided to focus on DingZing Advanced Materials' ROE.
Return on Equity or ROE is a test of how effectively a company is growing its value and managing investors’ money. Put another way, it reveals the company's success at turning shareholder investments into profits.
View our latest analysis for DingZing Advanced Materials
How Is ROE Calculated?
The formula for ROE is:
Return on Equity = Net Profit (from continuing operations) ÷ Shareholders' Equity
So, based on the above formula, the ROE for DingZing Advanced Materials is:
17% = NT$555m ÷ NT$3.3b (Based on the trailing twelve months to March 2024).
The 'return' refers to a company's earnings over the last year. Another way to think of that is that for every NT$1 worth of equity, the company was able to earn NT$0.17 in profit.
Why Is ROE Important For Earnings Growth?
So far, we've learned that ROE is a measure of a company's profitability. Based on how much of its profits the company chooses to reinvest or "retain", we are then able to evaluate a company's future ability to generate profits. Assuming all else is equal, companies that have both a higher return on equity and higher profit retention are usually the ones that have a higher growth rate when compared to companies that don't have the same features.
DingZing Advanced Materials' Earnings Growth And 17% ROE
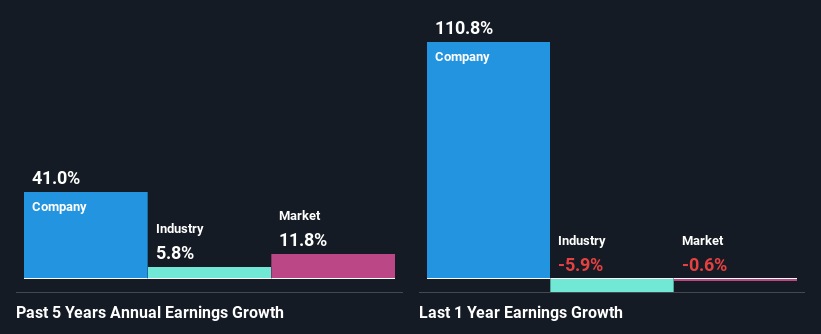
At first glance, DingZing Advanced Materials seems to have a decent ROE. On comparing with the average industry ROE of 7.0% the company's ROE looks pretty remarkable. Probably as a result of this, DingZing Advanced Materials was able to see an impressive net income growth of 41% over the last five years. We believe that there might also be other aspects that are positively influencing the company's earnings growth. For instance, the company has a low payout ratio or is being managed efficiently.
As a next step, we compared DingZing Advanced Materials' net income growth with the industry, and pleasingly, we found that the growth seen by the company is higher than the average industry growth of 5.8%.
Earnings growth is a huge factor in stock valuation. The investor should try to establish if the expected growth or decline in earnings, whichever the case may be, is priced in. Doing so will help them establish if the stock's future looks promising or ominous. Is DingZing Advanced Materials fairly valued compared to other companies? These 3 valuation measures might help you decide.
Is DingZing Advanced Materials Using Its Retained Earnings Effectively?
DingZing Advanced Materials' significant three-year median payout ratio of 74% (where it is retaining only 26% of its income) suggests that the company has been able to achieve a high growth in earnings despite returning most of its income to shareholders.
Additionally, DingZing Advanced Materials has paid dividends over a period of seven years which means that the company is pretty serious about sharing its profits with shareholders.
Summary
Overall, we are quite pleased with DingZing Advanced Materials' performance. We are particularly impressed by the considerable earnings growth posted by the company, which was likely backed by its high ROE. While the company is paying out most of its earnings as dividends, it has been able to grow its earnings in spite of it, so that's probably a good sign. Up till now, we've only made a short study of the company's growth data. So it may be worth checking this free detailed graph of DingZing Advanced Materials' past earnings, as well as revenue and cash flows to get a deeper insight into the company's performance.
New: Manage All Your Stock Portfolios in One Place
We've created the ultimate portfolio companion for stock investors, and it's free.
• Connect an unlimited number of Portfolios and see your total in one currency
• Be alerted to new Warning Signs or Risks via email or mobile
• Track the Fair Value of your stocks
Have feedback on this article? Concerned about the content? Get in touch with us directly. Alternatively, email editorial-team (at) simplywallst.com.
This article by Simply Wall St is general in nature. We provide commentary based on historical data and analyst forecasts only using an unbiased methodology and our articles are not intended to be financial advice. It does not constitute a recommendation to buy or sell any stock, and does not take account of your objectives, or your financial situation. We aim to bring you long-term focused analysis driven by fundamental data. Note that our analysis may not factor in the latest price-sensitive company announcements or qualitative material. Simply Wall St has no position in any stocks mentioned.
Have feedback on this article? Concerned about the content? Get in touch with us directly. Alternatively, email editorial-team@simplywallst.com
About TWSE:6585
DingZing Advanced Materials
Researches, develops, produces, and sells composite materials, technical films, and other components for various industries in Taiwan.
Solid track record with excellent balance sheet.

