Stock Analysis
The worst result, after buying shares in a company (assuming no leverage), would be if you lose all the money you put in. But on a lighter note, a good company can see its share price rise well over 100%. Long term San Fu Chemical Co., Ltd. (TWSE:4755) shareholders would be well aware of this, since the stock is up 235% in five years. It's also good to see the share price up 21% over the last quarter. But this could be related to the strong market, which is up 9.2% in the last three months.
Since it's been a strong week for San Fu Chemical shareholders, let's have a look at trend of the longer term fundamentals.
See our latest analysis for San Fu Chemical
While markets are a powerful pricing mechanism, share prices reflect investor sentiment, not just underlying business performance. One flawed but reasonable way to assess how sentiment around a company has changed is to compare the earnings per share (EPS) with the share price.
During five years of share price growth, San Fu Chemical actually saw its EPS drop 1.4% per year.
By glancing at these numbers, we'd posit that the decline in earnings per share is not representative of how the business has changed over the years. Since the change in EPS doesn't seem to correlate with the change in share price, it's worth taking a look at other metrics.
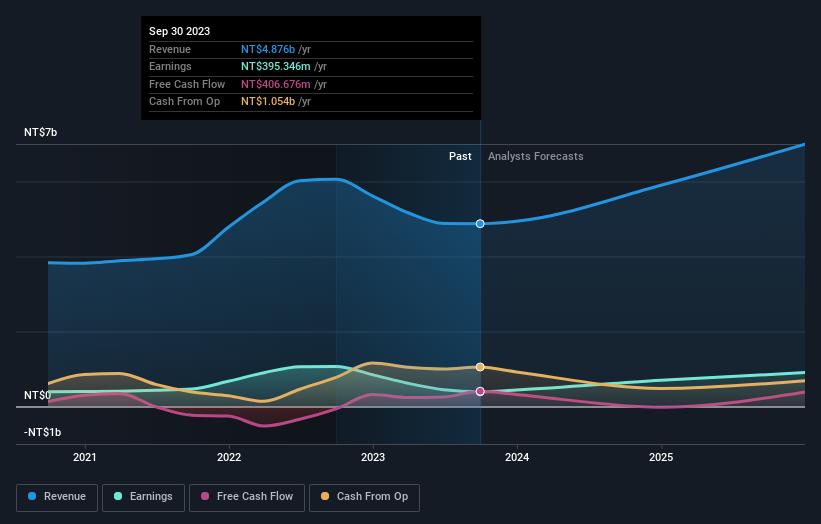
On the other hand, San Fu Chemical's revenue is growing nicely, at a compound rate of 7.9% over the last five years. It's quite possible that management are prioritizing revenue growth over EPS growth at the moment.
The graphic below depicts how earnings and revenue have changed over time (unveil the exact values by clicking on the image).
You can see how its balance sheet has strengthened (or weakened) over time in this free interactive graphic.
What About Dividends?
When looking at investment returns, it is important to consider the difference between total shareholder return (TSR) and share price return. Whereas the share price return only reflects the change in the share price, the TSR includes the value of dividends (assuming they were reinvested) and the benefit of any discounted capital raising or spin-off. Arguably, the TSR gives a more comprehensive picture of the return generated by a stock. We note that for San Fu Chemical the TSR over the last 5 years was 331%, which is better than the share price return mentioned above. The dividends paid by the company have thusly boosted the total shareholder return.
A Different Perspective
San Fu Chemical shareholders gained a total return of 22% during the year. But that was short of the market average. On the bright side, the longer term returns (running at about 34% a year, over half a decade) look better. It may well be that this is a business worth popping on the watching, given the continuing positive reception, over time, from the market. It's always interesting to track share price performance over the longer term. But to understand San Fu Chemical better, we need to consider many other factors. For instance, we've identified 2 warning signs for San Fu Chemical (1 is a bit unpleasant) that you should be aware of.
But note: San Fu Chemical may not be the best stock to buy. So take a peek at this free list of interesting companies with past earnings growth (and further growth forecast).
Please note, the market returns quoted in this article reflect the market weighted average returns of stocks that currently trade on Taiwanese exchanges.
Valuation is complex, but we're helping make it simple.
Find out whether San Fu Chemical is potentially over or undervalued by checking out our comprehensive analysis, which includes fair value estimates, risks and warnings, dividends, insider transactions and financial health.
View the Free AnalysisHave feedback on this article? Concerned about the content? Get in touch with us directly. Alternatively, email editorial-team (at) simplywallst.com.
This article by Simply Wall St is general in nature. We provide commentary based on historical data and analyst forecasts only using an unbiased methodology and our articles are not intended to be financial advice. It does not constitute a recommendation to buy or sell any stock, and does not take account of your objectives, or your financial situation. We aim to bring you long-term focused analysis driven by fundamental data. Note that our analysis may not factor in the latest price-sensitive company announcements or qualitative material. Simply Wall St has no position in any stocks mentioned.
About TWSE:4755
San Fu Chemical
San Fu Chemical Co., Ltd. manufactures and sells various chemical products primarily in Taiwan.
Excellent balance sheet with reasonable growth potential.

