Declining Stock and Solid Fundamentals: Is The Market Wrong About San Fu Chemical Co., Ltd. (TWSE:4755)?


It is hard to get excited after looking at San Fu Chemical's (TWSE:4755) recent performance, when its stock has declined 23% over the past month. However, a closer look at its sound financials might cause you to think again. Given that fundamentals usually drive long-term market outcomes, the company is worth looking at. In this article, we decided to focus on San Fu Chemical's ROE.
Return on equity or ROE is a key measure used to assess how efficiently a company's management is utilizing the company's capital. Put another way, it reveals the company's success at turning shareholder investments into profits.
View our latest analysis for San Fu Chemical
How Is ROE Calculated?
ROE can be calculated by using the formula:
Return on Equity = Net Profit (from continuing operations) ÷ Shareholders' Equity
So, based on the above formula, the ROE for San Fu Chemical is:
10% = NT$458m ÷ NT$4.4b (Based on the trailing twelve months to March 2024).
The 'return' is the income the business earned over the last year. So, this means that for every NT$1 of its shareholder's investments, the company generates a profit of NT$0.10.
What Has ROE Got To Do With Earnings Growth?
Thus far, we have learned that ROE measures how efficiently a company is generating its profits. Depending on how much of these profits the company reinvests or "retains", and how effectively it does so, we are then able to assess a company’s earnings growth potential. Assuming everything else remains unchanged, the higher the ROE and profit retention, the higher the growth rate of a company compared to companies that don't necessarily bear these characteristics.
San Fu Chemical's Earnings Growth And 10% ROE
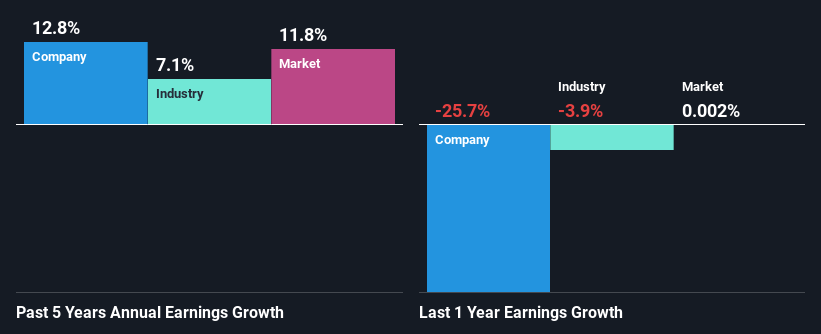
To start with, San Fu Chemical's ROE looks acceptable. On comparing with the average industry ROE of 7.0% the company's ROE looks pretty remarkable. This probably laid the ground for San Fu Chemical's moderate 13% net income growth seen over the past five years.
As a next step, we compared San Fu Chemical's net income growth with the industry, and pleasingly, we found that the growth seen by the company is higher than the average industry growth of 7.1%.
The basis for attaching value to a company is, to a great extent, tied to its earnings growth. The investor should try to establish if the expected growth or decline in earnings, whichever the case may be, is priced in. Doing so will help them establish if the stock's future looks promising or ominous. If you're wondering about San Fu Chemical's's valuation, check out this gauge of its price-to-earnings ratio, as compared to its industry.
Is San Fu Chemical Making Efficient Use Of Its Profits?
San Fu Chemical has a significant three-year median payout ratio of 70%, meaning that it is left with only 30% to reinvest into its business. This implies that the company has been able to achieve decent earnings growth despite returning most of its profits to shareholders.
Additionally, San Fu Chemical has paid dividends over a period of at least ten years which means that the company is pretty serious about sharing its profits with shareholders.
Summary
In total, we are pretty happy with San Fu Chemical's performance. In particular, its high ROE is quite noteworthy and also the probable explanation behind its considerable earnings growth. Yet, the company is retaining a small portion of its profits. Which means that the company has been able to grow its earnings in spite of it, so that's not too bad. With that said, the latest industry analyst forecasts reveal that the company's earnings are expected to accelerate. To know more about the latest analysts predictions for the company, check out this visualization of analyst forecasts for the company.
New: Manage All Your Stock Portfolios in One Place
We've created the ultimate portfolio companion for stock investors, and it's free.
• Connect an unlimited number of Portfolios and see your total in one currency
• Be alerted to new Warning Signs or Risks via email or mobile
• Track the Fair Value of your stocks
Have feedback on this article? Concerned about the content? Get in touch with us directly. Alternatively, email editorial-team (at) simplywallst.com.
This article by Simply Wall St is general in nature. We provide commentary based on historical data and analyst forecasts only using an unbiased methodology and our articles are not intended to be financial advice. It does not constitute a recommendation to buy or sell any stock, and does not take account of your objectives, or your financial situation. We aim to bring you long-term focused analysis driven by fundamental data. Note that our analysis may not factor in the latest price-sensitive company announcements or qualitative material. Simply Wall St has no position in any stocks mentioned.
Have feedback on this article? Concerned about the content? Get in touch with us directly. Alternatively, email editorial-team@simplywallst.com
About TWSE:4755
San Fu Chemical
Manufactures and sells various chemical products in Taiwan.
Excellent balance sheet with reasonable growth potential and pays a dividend.

