- Taiwan
- /
- Metals and Mining
- /
- TWSE:2032
Sinkang Industries Co., Ltd.'s (TWSE:2032) Stock Is Rallying But Financials Look Ambiguous: Will The Momentum Continue?


Sinkang Industries' (TWSE:2032) stock is up by a considerable 11% over the past month. However, we wonder if the company's inconsistent financials would have any adverse impact on the current share price momentum. Particularly, we will be paying attention to Sinkang Industries' ROE today.
ROE or return on equity is a useful tool to assess how effectively a company can generate returns on the investment it received from its shareholders. Simply put, it is used to assess the profitability of a company in relation to its equity capital.
Check out our latest analysis for Sinkang Industries
How Do You Calculate Return On Equity?
Return on equity can be calculated by using the formula:
Return on Equity = Net Profit (from continuing operations) ÷ Shareholders' Equity
So, based on the above formula, the ROE for Sinkang Industries is:
2.4% = NT$41m ÷ NT$1.7b (Based on the trailing twelve months to June 2024).
The 'return' is the yearly profit. That means that for every NT$1 worth of shareholders' equity, the company generated NT$0.02 in profit.
What Has ROE Got To Do With Earnings Growth?
Thus far, we have learned that ROE measures how efficiently a company is generating its profits. Depending on how much of these profits the company reinvests or "retains", and how effectively it does so, we are then able to assess a company’s earnings growth potential. Generally speaking, other things being equal, firms with a high return on equity and profit retention, have a higher growth rate than firms that don’t share these attributes.
A Side By Side comparison of Sinkang Industries' Earnings Growth And 2.4% ROE
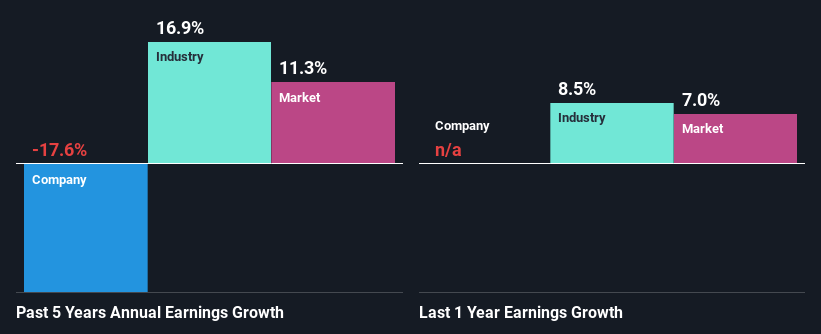
It is hard to argue that Sinkang Industries' ROE is much good in and of itself. Not just that, even compared to the industry average of 7.2%, the company's ROE is entirely unremarkable. Given the circumstances, the significant decline in net income by 18% seen by Sinkang Industries over the last five years is not surprising. We believe that there also might be other aspects that are negatively influencing the company's earnings prospects. For instance, the company has a very high payout ratio, or is faced with competitive pressures.
However, when we compared Sinkang Industries' growth with the industry we found that while the company's earnings have been shrinking, the industry has seen an earnings growth of 17% in the same period. This is quite worrisome.
The basis for attaching value to a company is, to a great extent, tied to its earnings growth. What investors need to determine next is if the expected earnings growth, or the lack of it, is already built into the share price. By doing so, they will have an idea if the stock is headed into clear blue waters or if swampy waters await. If you're wondering about Sinkang Industries''s valuation, check out this gauge of its price-to-earnings ratio, as compared to its industry.
Is Sinkang Industries Using Its Retained Earnings Effectively?
While the company did payout a portion of its dividend in the past, it currently doesn't pay a regular dividend. This implies that potentially all of its profits are being reinvested in the business.
Conclusion
On the whole, we feel that the performance shown by Sinkang Industries can be open to many interpretations. Even though it appears to be retaining most of its profits, given the low ROE, investors may not be benefitting from all that reinvestment after all. The low earnings growth suggests our theory correct. Up till now, we've only made a short study of the company's growth data. So it may be worth checking this free detailed graph of Sinkang Industries' past earnings, as well as revenue and cash flows to get a deeper insight into the company's performance.
New: Manage All Your Stock Portfolios in One Place
We've created the ultimate portfolio companion for stock investors, and it's free.
• Connect an unlimited number of Portfolios and see your total in one currency
• Be alerted to new Warning Signs or Risks via email or mobile
• Track the Fair Value of your stocks
Have feedback on this article? Concerned about the content? Get in touch with us directly. Alternatively, email editorial-team (at) simplywallst.com.
This article by Simply Wall St is general in nature. We provide commentary based on historical data and analyst forecasts only using an unbiased methodology and our articles are not intended to be financial advice. It does not constitute a recommendation to buy or sell any stock, and does not take account of your objectives, or your financial situation. We aim to bring you long-term focused analysis driven by fundamental data. Note that our analysis may not factor in the latest price-sensitive company announcements or qualitative material. Simply Wall St has no position in any stocks mentioned.
About TWSE:2032
Sinkang Industries
Manufactures and sells stainless steel in Taiwan and internationally.
Excellent balance sheet with questionable track record.
