G-SHANK Enterprise's (TWSE:2476) five-year total shareholder returns outpace the underlying earnings growth


For many, the main point of investing in the stock market is to achieve spectacular returns. And highest quality companies can see their share prices grow by huge amounts. For example, the G-SHANK Enterprise Co., Ltd. (TWSE:2476) share price is up a whopping 305% in the last half decade, a handsome return for long term holders. If that doesn't get you thinking about long term investing, we don't know what will. In more good news, the share price has risen 15% in thirty days. We note that G-SHANK Enterprise reported its financial results recently; luckily, you can catch up on the latest revenue and profit numbers in our company report.
Although G-SHANK Enterprise has shed NT$2.0b from its market cap this week, let's take a look at its longer term fundamental trends and see if they've driven returns.
See our latest analysis for G-SHANK Enterprise
While the efficient markets hypothesis continues to be taught by some, it has been proven that markets are over-reactive dynamic systems, and investors are not always rational. One way to examine how market sentiment has changed over time is to look at the interaction between a company's share price and its earnings per share (EPS).
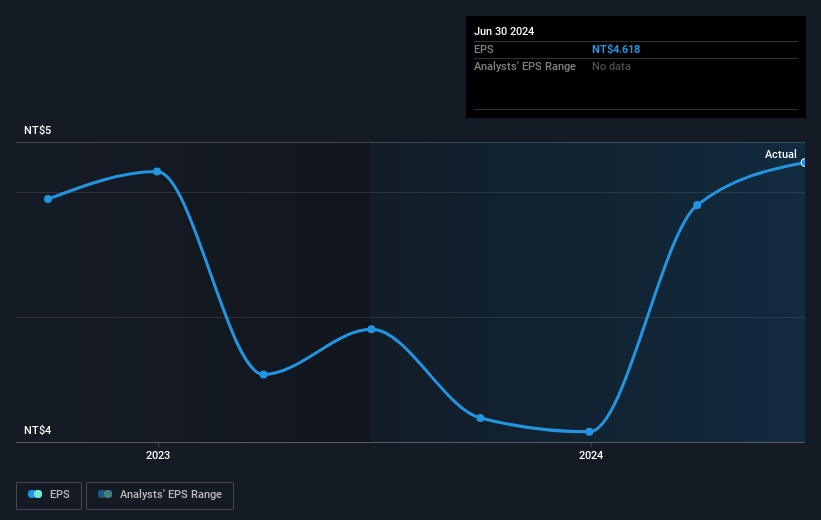
Over half a decade, G-SHANK Enterprise managed to grow its earnings per share at 17% a year. This EPS growth is slower than the share price growth of 32% per year, over the same period. So it's fair to assume the market has a higher opinion of the business than it did five years ago. And that's hardly shocking given the track record of growth.
The company's earnings per share (over time) is depicted in the image below (click to see the exact numbers).
Before buying or selling a stock, we always recommend a close examination of historic growth trends, available here.
What About Dividends?
It is important to consider the total shareholder return, as well as the share price return, for any given stock. The TSR incorporates the value of any spin-offs or discounted capital raisings, along with any dividends, based on the assumption that the dividends are reinvested. So for companies that pay a generous dividend, the TSR is often a lot higher than the share price return. As it happens, G-SHANK Enterprise's TSR for the last 5 years was 398%, which exceeds the share price return mentioned earlier. This is largely a result of its dividend payments!
A Different Perspective
We're pleased to report that G-SHANK Enterprise shareholders have received a total shareholder return of 100% over one year. That's including the dividend. That gain is better than the annual TSR over five years, which is 38%. Therefore it seems like sentiment around the company has been positive lately. Someone with an optimistic perspective could view the recent improvement in TSR as indicating that the business itself is getting better with time. It's always interesting to track share price performance over the longer term. But to understand G-SHANK Enterprise better, we need to consider many other factors. Like risks, for instance. Every company has them, and we've spotted 3 warning signs for G-SHANK Enterprise (of which 1 is potentially serious!) you should know about.
Of course, you might find a fantastic investment by looking elsewhere. So take a peek at this free list of companies we expect will grow earnings.
Please note, the market returns quoted in this article reflect the market weighted average returns of stocks that currently trade on Taiwanese exchanges.
New: Manage All Your Stock Portfolios in One Place
We've created the ultimate portfolio companion for stock investors, and it's free.
• Connect an unlimited number of Portfolios and see your total in one currency
• Be alerted to new Warning Signs or Risks via email or mobile
• Track the Fair Value of your stocks
Have feedback on this article? Concerned about the content? Get in touch with us directly. Alternatively, email editorial-team (at) simplywallst.com.
This article by Simply Wall St is general in nature. We provide commentary based on historical data and analyst forecasts only using an unbiased methodology and our articles are not intended to be financial advice. It does not constitute a recommendation to buy or sell any stock, and does not take account of your objectives, or your financial situation. We aim to bring you long-term focused analysis driven by fundamental data. Note that our analysis may not factor in the latest price-sensitive company announcements or qualitative material. Simply Wall St has no position in any stocks mentioned.
About TWSE:2476
G-SHANK Enterprise
An investment holding company, engages in the production and sales of molds, stamping parts, fixtures and tools, automatic machines and electrical appliances, and mechanical components in Taiwan and internationally.
Excellent balance sheet with acceptable track record.

