Stock Analysis

Taiwan Glass Ind (TWSE:1802) Full Year 2023 Results
Key Financial Results
- Revenue: NT$45.6b (up 4.0% from FY 2022).
- Net income: NT$34.6m (up from NT$594.8m loss in FY 2022).
- Profit margin: 0.1% (up from net loss in FY 2022). The move to profitability was driven by higher revenue.
- EPS: NT$0.01 (up from NT$0.20 loss in FY 2022).
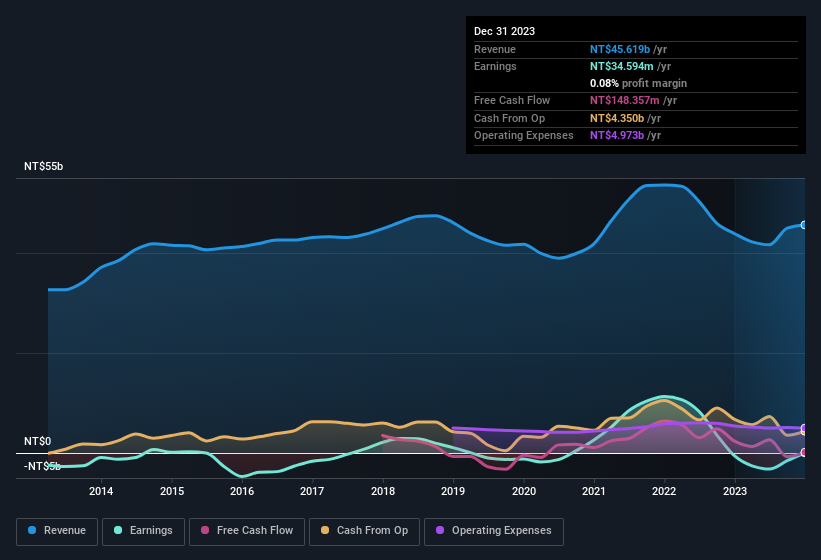
All figures shown in the chart above are for the trailing 12 month (TTM) period
Taiwan Glass Ind shares are down 3.3% from a week ago.
Balance Sheet Analysis
While it's very important to consider the profit and loss statement, you can also learn a lot about a company by looking at its balance sheet. We've done some analysis and you can see our take on Taiwan Glass Ind's balance sheet.
Valuation is complex, but we're helping make it simple.
Find out whether Taiwan Glass Ind is potentially over or undervalued by checking out our comprehensive analysis, which includes fair value estimates, risks and warnings, dividends, insider transactions and financial health.
View the Free AnalysisHave feedback on this article? Concerned about the content? Get in touch with us directly. Alternatively, email editorial-team (at) simplywallst.com.
This article by Simply Wall St is general in nature. We provide commentary based on historical data and analyst forecasts only using an unbiased methodology and our articles are not intended to be financial advice. It does not constitute a recommendation to buy or sell any stock, and does not take account of your objectives, or your financial situation. We aim to bring you long-term focused analysis driven by fundamental data. Note that our analysis may not factor in the latest price-sensitive company announcements or qualitative material. Simply Wall St has no position in any stocks mentioned.
About TWSE:1802
Taiwan Glass Ind
Taiwan Glass Ind. Corp. manufactures, processes, and sells various glass products in Taiwan and internationally.
Adequate balance sheet with questionable track record.

