- Taiwan
- /
- Trade Distributors
- /
- TWSE:1725
Yuan Jen EnterprisesLtd's (TWSE:1725) five-year earnings growth trails the incredible shareholder returns


The most you can lose on any stock (assuming you don't use leverage) is 100% of your money. But on the bright side, if you buy shares in a high quality company at the right price, you can gain well over 100%. For example, the Yuan Jen Enterprises Co.,Ltd. (TWSE:1725) share price has soared 246% in the last half decade. Most would be very happy with that. On top of that, the share price is up 48% in about a quarter.
The past week has proven to be lucrative for Yuan Jen EnterprisesLtd investors, so let's see if fundamentals drove the company's five-year performance.
See our latest analysis for Yuan Jen EnterprisesLtd
While the efficient markets hypothesis continues to be taught by some, it has been proven that markets are over-reactive dynamic systems, and investors are not always rational. One flawed but reasonable way to assess how sentiment around a company has changed is to compare the earnings per share (EPS) with the share price.
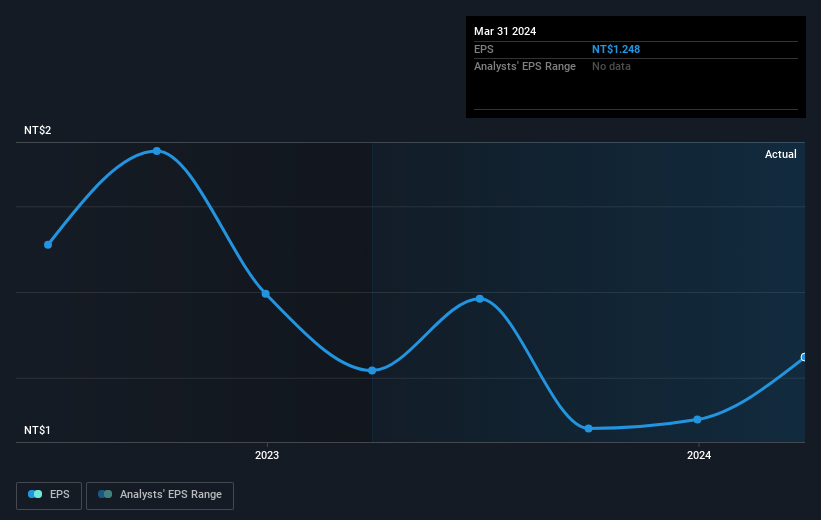
During five years of share price growth, Yuan Jen EnterprisesLtd achieved compound earnings per share (EPS) growth of 1.0% per year. This EPS growth is slower than the share price growth of 28% per year, over the same period. This suggests that market participants hold the company in higher regard, these days. That's not necessarily surprising considering the five-year track record of earnings growth.
You can see below how EPS has changed over time (discover the exact values by clicking on the image).
This free interactive report on Yuan Jen EnterprisesLtd's earnings, revenue and cash flow is a great place to start, if you want to investigate the stock further.
What About Dividends?
It is important to consider the total shareholder return, as well as the share price return, for any given stock. The TSR incorporates the value of any spin-offs or discounted capital raisings, along with any dividends, based on the assumption that the dividends are reinvested. So for companies that pay a generous dividend, the TSR is often a lot higher than the share price return. As it happens, Yuan Jen EnterprisesLtd's TSR for the last 5 years was 348%, which exceeds the share price return mentioned earlier. This is largely a result of its dividend payments!
A Different Perspective
It's good to see that Yuan Jen EnterprisesLtd has rewarded shareholders with a total shareholder return of 157% in the last twelve months. That's including the dividend. That's better than the annualised return of 35% over half a decade, implying that the company is doing better recently. Someone with an optimistic perspective could view the recent improvement in TSR as indicating that the business itself is getting better with time. It's always interesting to track share price performance over the longer term. But to understand Yuan Jen EnterprisesLtd better, we need to consider many other factors. Take risks, for example - Yuan Jen EnterprisesLtd has 1 warning sign we think you should be aware of.
Of course Yuan Jen EnterprisesLtd may not be the best stock to buy. So you may wish to see this free collection of growth stocks.
Please note, the market returns quoted in this article reflect the market weighted average returns of stocks that currently trade on Taiwanese exchanges.
New: Manage All Your Stock Portfolios in One Place
We've created the ultimate portfolio companion for stock investors, and it's free.
• Connect an unlimited number of Portfolios and see your total in one currency
• Be alerted to new Warning Signs or Risks via email or mobile
• Track the Fair Value of your stocks
Have feedback on this article? Concerned about the content? Get in touch with us directly. Alternatively, email editorial-team (at) simplywallst.com.
This article by Simply Wall St is general in nature. We provide commentary based on historical data and analyst forecasts only using an unbiased methodology and our articles are not intended to be financial advice. It does not constitute a recommendation to buy or sell any stock, and does not take account of your objectives, or your financial situation. We aim to bring you long-term focused analysis driven by fundamental data. Note that our analysis may not factor in the latest price-sensitive company announcements or qualitative material. Simply Wall St has no position in any stocks mentioned.
Have feedback on this article? Concerned about the content? Get in touch with us directly. Alternatively, email editorial-team@simplywallst.com
About TWSE:1725
Excellent balance sheet average dividend payer.

