- Taiwan
- /
- Trade Distributors
- /
- TWSE:1725
Yuan Jen Enterprises Co.,Ltd.'s (TWSE:1725) Financials Are Too Obscure To Link With Current Share Price Momentum: What's In Store For the Stock?


Most readers would already be aware that Yuan Jen EnterprisesLtd's (TWSE:1725) stock increased significantly by 11% over the past week. But the company's key financial indicators appear to be differing across the board and that makes us question whether or not the company's current share price momentum can be maintained. In this article, we decided to focus on Yuan Jen EnterprisesLtd's ROE.
ROE or return on equity is a useful tool to assess how effectively a company can generate returns on the investment it received from its shareholders. Simply put, it is used to assess the profitability of a company in relation to its equity capital.
Check out our latest analysis for Yuan Jen EnterprisesLtd
How Do You Calculate Return On Equity?
Return on equity can be calculated by using the formula:
Return on Equity = Net Profit (from continuing operations) ÷ Shareholders' Equity
So, based on the above formula, the ROE for Yuan Jen EnterprisesLtd is:
4.8% = NT$249m ÷ NT$5.2b (Based on the trailing twelve months to June 2024).
The 'return' is the income the business earned over the last year. That means that for every NT$1 worth of shareholders' equity, the company generated NT$0.05 in profit.
Why Is ROE Important For Earnings Growth?
So far, we've learned that ROE is a measure of a company's profitability. We now need to evaluate how much profit the company reinvests or "retains" for future growth which then gives us an idea about the growth potential of the company. Assuming everything else remains unchanged, the higher the ROE and profit retention, the higher the growth rate of a company compared to companies that don't necessarily bear these characteristics.
Yuan Jen EnterprisesLtd's Earnings Growth And 4.8% ROE
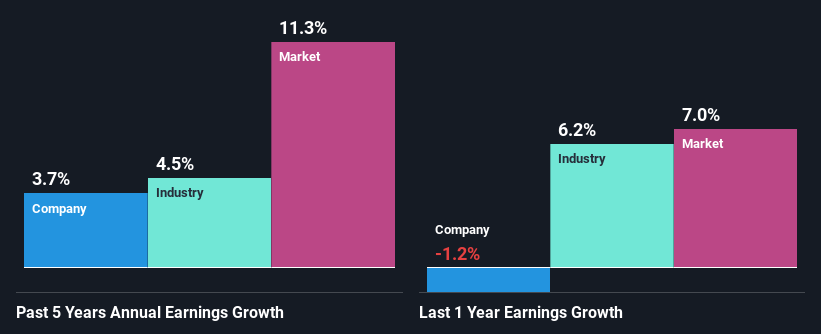
When you first look at it, Yuan Jen EnterprisesLtd's ROE doesn't look that attractive. We then compared the company's ROE to the broader industry and were disappointed to see that the ROE is lower than the industry average of 12%. Accordingly, Yuan Jen EnterprisesLtd's low net income growth of 3.7% over the past five years can possibly be explained by the low ROE amongst other factors.
We then performed a comparison between Yuan Jen EnterprisesLtd's net income growth with the industry, which revealed that the company's growth is similar to the average industry growth of 4.5% in the same 5-year period.
Earnings growth is an important metric to consider when valuing a stock. It’s important for an investor to know whether the market has priced in the company's expected earnings growth (or decline). Doing so will help them establish if the stock's future looks promising or ominous. Is Yuan Jen EnterprisesLtd fairly valued compared to other companies? These 3 valuation measures might help you decide.
Is Yuan Jen EnterprisesLtd Making Efficient Use Of Its Profits?
With a high three-year median payout ratio of 71% (or a retention ratio of 29%), most of Yuan Jen EnterprisesLtd's profits are being paid to shareholders. This definitely contributes to the low earnings growth seen by the company.
Additionally, Yuan Jen EnterprisesLtd has paid dividends over a period of at least ten years, which means that the company's management is determined to pay dividends even if it means little to no earnings growth.
Conclusion
On the whole, we feel that the performance shown by Yuan Jen EnterprisesLtd can be open to many interpretations. While the company has posted a decent earnings growth, We do feel that the earnings growth number could have been even higher, had the company been reinvesting more of its earnings at a higher rate of return. Wrapping up, we would proceed with caution with this company and one way of doing that would be to look at the risk profile of the business. To know the 2 risks we have identified for Yuan Jen EnterprisesLtd visit our risks dashboard for free.
New: Manage All Your Stock Portfolios in One Place
We've created the ultimate portfolio companion for stock investors, and it's free.
• Connect an unlimited number of Portfolios and see your total in one currency
• Be alerted to new Warning Signs or Risks via email or mobile
• Track the Fair Value of your stocks
Have feedback on this article? Concerned about the content? Get in touch with us directly. Alternatively, email editorial-team (at) simplywallst.com.
This article by Simply Wall St is general in nature. We provide commentary based on historical data and analyst forecasts only using an unbiased methodology and our articles are not intended to be financial advice. It does not constitute a recommendation to buy or sell any stock, and does not take account of your objectives, or your financial situation. We aim to bring you long-term focused analysis driven by fundamental data. Note that our analysis may not factor in the latest price-sensitive company announcements or qualitative material. Simply Wall St has no position in any stocks mentioned.
About TWSE:1725
Excellent balance sheet average dividend payer.

