Stock Analysis

Legendary fund manager Li Lu (who Charlie Munger backed) once said, 'The biggest investment risk is not the volatility of prices, but whether you will suffer a permanent loss of capital.' So it seems the smart money knows that debt - which is usually involved in bankruptcies - is a very important factor, when you assess how risky a company is. Importantly, Intereuropa, d. d. (LJSE:IEKG) does carry debt. But is this debt a concern to shareholders?
When Is Debt Dangerous?
Generally speaking, debt only becomes a real problem when a company can't easily pay it off, either by raising capital or with its own cash flow. If things get really bad, the lenders can take control of the business. While that is not too common, we often do see indebted companies permanently diluting shareholders because lenders force them to raise capital at a distressed price. Having said that, the most common situation is where a company manages its debt reasonably well - and to its own advantage. When we think about a company's use of debt, we first look at cash and debt together.
View our latest analysis for Intereuropa d. d
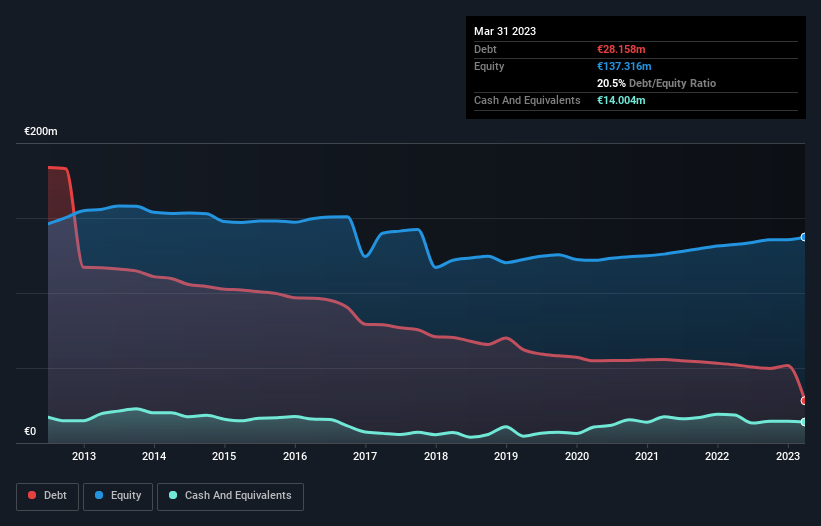
What Is Intereuropa d. d's Net Debt?
You can click the graphic below for the historical numbers, but it shows that Intereuropa d. d had €28.2m of debt in March 2023, down from €52.1m, one year before. However, it does have €14.0m in cash offsetting this, leading to net debt of about €14.2m.
How Healthy Is Intereuropa d. d's Balance Sheet?
Zooming in on the latest balance sheet data, we can see that Intereuropa d. d had liabilities of €62.6m due within 12 months and liabilities of €42.8m due beyond that. Offsetting this, it had €14.0m in cash and €45.4m in receivables that were due within 12 months. So it has liabilities totalling €46.0m more than its cash and near-term receivables, combined.
This deficit casts a shadow over the €21.9m company, like a colossus towering over mere mortals. So we'd watch its balance sheet closely, without a doubt. After all, Intereuropa d. d would likely require a major re-capitalisation if it had to pay its creditors today.
We measure a company's debt load relative to its earnings power by looking at its net debt divided by its earnings before interest, tax, depreciation, and amortization (EBITDA) and by calculating how easily its earnings before interest and tax (EBIT) cover its interest expense (interest cover). The advantage of this approach is that we take into account both the absolute quantum of debt (with net debt to EBITDA) and the actual interest expenses associated with that debt (with its interest cover ratio).
While Intereuropa d. d's low debt to EBITDA ratio of 1.1 suggests only modest use of debt, the fact that EBIT only covered the interest expense by 4.9 times last year does give us pause. But the interest payments are certainly sufficient to have us thinking about how affordable its debt is. Intereuropa d. d grew its EBIT by 7.0% in the last year. That's far from incredible but it is a good thing, when it comes to paying off debt. The balance sheet is clearly the area to focus on when you are analysing debt. But you can't view debt in total isolation; since Intereuropa d. d will need earnings to service that debt. So if you're keen to discover more about its earnings, it might be worth checking out this graph of its long term earnings trend.
Finally, a business needs free cash flow to pay off debt; accounting profits just don't cut it. So the logical step is to look at the proportion of that EBIT that is matched by actual free cash flow. Over the most recent three years, Intereuropa d. d recorded free cash flow worth 69% of its EBIT, which is around normal, given free cash flow excludes interest and tax. This free cash flow puts the company in a good position to pay down debt, when appropriate.
Our View
Intereuropa d. d's struggle to handle its total liabilities had us second guessing its balance sheet strength, but the other data-points we considered were relatively redeeming. For example its conversion of EBIT to free cash flow was refreshing. Taking the abovementioned factors together we do think Intereuropa d. d's debt poses some risks to the business. So while that leverage does boost returns on equity, we wouldn't really want to see it increase from here. The balance sheet is clearly the area to focus on when you are analysing debt. However, not all investment risk resides within the balance sheet - far from it. For example, we've discovered 3 warning signs for Intereuropa d. d (1 doesn't sit too well with us!) that you should be aware of before investing here.
If you're interested in investing in businesses that can grow profits without the burden of debt, then check out this free list of growing businesses that have net cash on the balance sheet.
Valuation is complex, but we're helping make it simple.
Find out whether Intereuropa d. d is potentially over or undervalued by checking out our comprehensive analysis, which includes fair value estimates, risks and warnings, dividends, insider transactions and financial health.
View the Free AnalysisHave feedback on this article? Concerned about the content? Get in touch with us directly. Alternatively, email editorial-team (at) simplywallst.com.
This article by Simply Wall St is general in nature. We provide commentary based on historical data and analyst forecasts only using an unbiased methodology and our articles are not intended to be financial advice. It does not constitute a recommendation to buy or sell any stock, and does not take account of your objectives, or your financial situation. We aim to bring you long-term focused analysis driven by fundamental data. Note that our analysis may not factor in the latest price-sensitive company announcements or qualitative material. Simply Wall St has no position in any stocks mentioned.
About LJSE:IEKG
Intereuropa d. d
Intereuropa, d. d., together with its subsidiaries, provides logistics services in Slovenia, Croatia, Montenegro, Bosnia and Herzegovina, Serbia, Kosovo, North Macedonia, Albania, and Ukraine.
Excellent balance sheet with proven track record.

