Stock Analysis
- Slovenia
- /
- Specialty Stores
- /
- LJSE:PETG
Does Petrol d.d.'s (LJSE:PETG) Weak Fundamentals Mean That The Market Could Correct Its Share Price?


Petrol d.d's (LJSE:PETG) stock is up by a considerable 16% over the past month. We, however wanted to have a closer look at its key financial indicators as the markets usually pay for long-term fundamentals, and in this case, they don't look very promising. In this article, we decided to focus on Petrol d.d's ROE.
Return on Equity or ROE is a test of how effectively a company is growing its value and managing investors’ money. Simply put, it is used to assess the profitability of a company in relation to its equity capital.
View our latest analysis for Petrol d.d
How Do You Calculate Return On Equity?
Return on equity can be calculated by using the formula:
Return on Equity = Net Profit (from continuing operations) ÷ Shareholders' Equity
So, based on the above formula, the ROE for Petrol d.d is:
7.6% = €68m ÷ €903m (Based on the trailing twelve months to September 2023).
The 'return' is the income the business earned over the last year. That means that for every €1 worth of shareholders' equity, the company generated €0.08 in profit.
Why Is ROE Important For Earnings Growth?
So far, we've learned that ROE is a measure of a company's profitability. We now need to evaluate how much profit the company reinvests or "retains" for future growth which then gives us an idea about the growth potential of the company. Assuming all else is equal, companies that have both a higher return on equity and higher profit retention are usually the ones that have a higher growth rate when compared to companies that don't have the same features.
A Side By Side comparison of Petrol d.d's Earnings Growth And 7.6% ROE
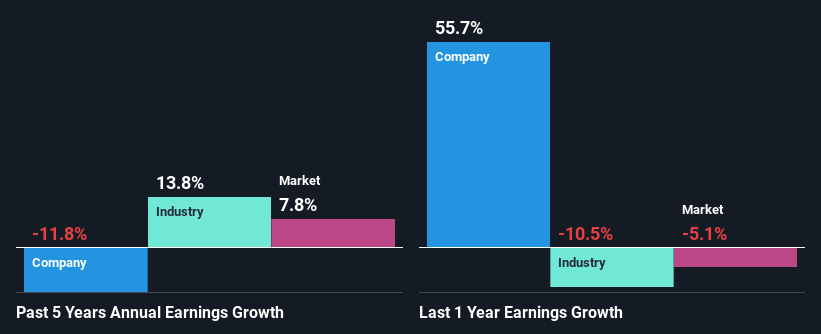
At first glance, Petrol d.d's ROE doesn't look very promising. A quick further study shows that the company's ROE doesn't compare favorably to the industry average of 11% either. Therefore, it might not be wrong to say that the five year net income decline of 12% seen by Petrol d.d was probably the result of it having a lower ROE. We reckon that there could also be other factors at play here. For instance, the company has a very high payout ratio, or is faced with competitive pressures.
That being said, we compared Petrol d.d's performance with the industry and were concerned when we found that while the company has shrunk its earnings, the industry has grown its earnings at a rate of 14% in the same 5-year period.
Earnings growth is a huge factor in stock valuation. What investors need to determine next is if the expected earnings growth, or the lack of it, is already built into the share price. This then helps them determine if the stock is placed for a bright or bleak future. If you're wondering about Petrol d.d's's valuation, check out this gauge of its price-to-earnings ratio, as compared to its industry.
Is Petrol d.d Making Efficient Use Of Its Profits?
Petrol d.d's declining earnings is not surprising given how the company is spending most of its profits in paying dividends, judging by its three-year median payout ratio of 72% (or a retention ratio of 28%). With only very little left to reinvest into the business, growth in earnings is far from likely.
Additionally, Petrol d.d has paid dividends over a period of at least ten years, which means that the company's management is determined to pay dividends even if it means little to no earnings growth.
Summary
On the whole, Petrol d.d's performance is quite a big let-down. As a result of its low ROE and lack of much reinvestment into the business, the company has seen a disappointing earnings growth rate. So far, we've only made a quick discussion around the company's earnings growth. You can do your own research on Petrol d.d and see how it has performed in the past by looking at this FREE detailed graph of past earnings, revenue and cash flows.
Valuation is complex, but we're helping make it simple.
Find out whether Petrol d.d is potentially over or undervalued by checking out our comprehensive analysis, which includes fair value estimates, risks and warnings, dividends, insider transactions and financial health.
View the Free AnalysisHave feedback on this article? Concerned about the content? Get in touch with us directly. Alternatively, email editorial-team (at) simplywallst.com.
This article by Simply Wall St is general in nature. We provide commentary based on historical data and analyst forecasts only using an unbiased methodology and our articles are not intended to be financial advice. It does not constitute a recommendation to buy or sell any stock, and does not take account of your objectives, or your financial situation. We aim to bring you long-term focused analysis driven by fundamental data. Note that our analysis may not factor in the latest price-sensitive company announcements or qualitative material. Simply Wall St has no position in any stocks mentioned.
About LJSE:PETG
Petrol d.d
Petrol d.d., through its subsidiaries, sells petroleum and other energy products in Slovenia and internationally.
Excellent balance sheet established dividend payer.
