Stock Analysis
- Singapore
- /
- Semiconductors
- /
- SGX:AWX
AEM Holdings (SGX:AWX) delivers shareholders strong 20% CAGR over 5 years, surging 14% in the last week alone

It hasn't been the best quarter for AEM Holdings Ltd. (SGX:AWX) shareholders, since the share price has fallen 27% in that time. But that doesn't change the fact that shareholders have received really good returns over the last five years. It's fair to say most would be happy with 125% the gain in that time. So while it's never fun to see a share price fall, it's important to look at a longer time horizon. Of course, that doesn't necessarily mean it's cheap now. Unfortunately not all shareholders will have held it for five years, so spare a thought for those caught in the 39% decline over the last three years: that's a long time to wait for profits.
The past week has proven to be lucrative for AEM Holdings investors, so let's see if fundamentals drove the company's five-year performance.
See our latest analysis for AEM Holdings
While the efficient markets hypothesis continues to be taught by some, it has been proven that markets are over-reactive dynamic systems, and investors are not always rational. By comparing earnings per share (EPS) and share price changes over time, we can get a feel for how investor attitudes to a company have morphed over time.
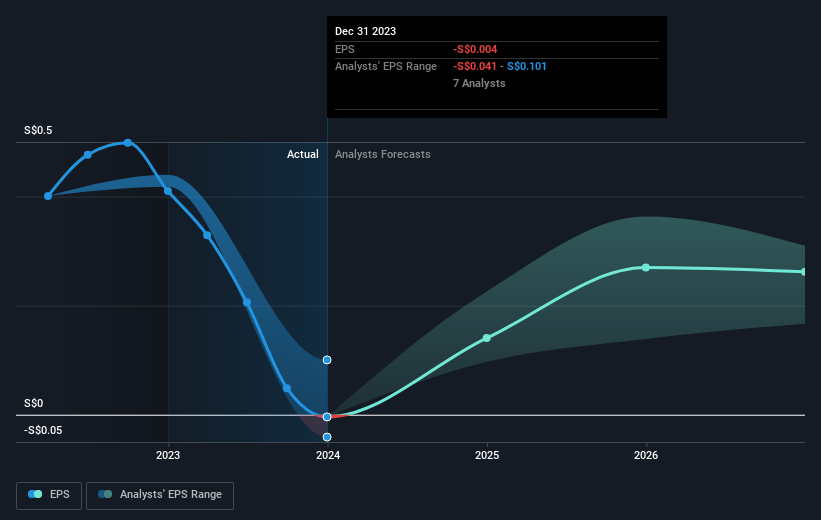
During five years of share price growth, AEM Holdings achieved compound earnings per share (EPS) growth of 5.7% per year. We do note that extraordinary items have impacted its earnings history. This EPS growth is slower than the share price growth of 18% per year, over the same period. So it's fair to assume the market has a higher opinion of the business than it did five years ago. That's not necessarily surprising considering the five-year track record of earnings growth.
The company's earnings per share (over time) is depicted in the image below (click to see the exact numbers).
This free interactive report on AEM Holdings' earnings, revenue and cash flow is a great place to start, if you want to investigate the stock further.
What About The Total Shareholder Return (TSR)?
Investors should note that there's a difference between AEM Holdings' total shareholder return (TSR) and its share price change, which we've covered above. The TSR is a return calculation that accounts for the value of cash dividends (assuming that any dividend received was reinvested) and the calculated value of any discounted capital raisings and spin-offs. Dividends have been really beneficial for AEM Holdings shareholders, and that cash payout contributed to why its TSR of 152%, over the last 5 years, is better than the share price return.
A Different Perspective
We regret to report that AEM Holdings shareholders are down 25% for the year. Unfortunately, that's worse than the broader market decline of 1.0%. However, it could simply be that the share price has been impacted by broader market jitters. It might be worth keeping an eye on the fundamentals, in case there's a good opportunity. On the bright side, long term shareholders have made money, with a gain of 20% per year over half a decade. It could be that the recent sell-off is an opportunity, so it may be worth checking the fundamental data for signs of a long term growth trend. Most investors take the time to check the data on insider transactions. You can click here to see if insiders have been buying or selling.
For those who like to find winning investments this free list of growing companies with recent insider purchasing, could be just the ticket.
Please note, the market returns quoted in this article reflect the market weighted average returns of stocks that currently trade on Singaporean exchanges.
Valuation is complex, but we're helping make it simple.
Find out whether AEM Holdings is potentially over or undervalued by checking out our comprehensive analysis, which includes fair value estimates, risks and warnings, dividends, insider transactions and financial health.
View the Free AnalysisHave feedback on this article? Concerned about the content? Get in touch with us directly. Alternatively, email editorial-team (at) simplywallst.com.
This article by Simply Wall St is general in nature. We provide commentary based on historical data and analyst forecasts only using an unbiased methodology and our articles are not intended to be financial advice. It does not constitute a recommendation to buy or sell any stock, and does not take account of your objectives, or your financial situation. We aim to bring you long-term focused analysis driven by fundamental data. Note that our analysis may not factor in the latest price-sensitive company announcements or qualitative material. Simply Wall St has no position in any stocks mentioned.
About SGX:AWX
AEM Holdings
AEM Holdings Ltd., together with its subsidiaries, provides application-specific intelligent system tests and handling solutions for semiconductor and electronics companies.
Undervalued with excellent balance sheet.
