Stock Analysis
Is Weakness In NCAB Group AB (publ) (STO:NCAB) Stock A Sign That The Market Could be Wrong Given Its Strong Financial Prospects?

With its stock down 8.0% over the past week, it is easy to disregard NCAB Group (STO:NCAB). But if you pay close attention, you might gather that its strong financials could mean that the stock could potentially see an increase in value in the long-term, given how markets usually reward companies with good financial health. In this article, we decided to focus on NCAB Group's ROE.
Return on equity or ROE is a key measure used to assess how efficiently a company's management is utilizing the company's capital. In simpler terms, it measures the profitability of a company in relation to shareholder's equity.
Check out our latest analysis for NCAB Group
How Is ROE Calculated?
Return on equity can be calculated by using the formula:
Return on Equity = Net Profit (from continuing operations) ÷ Shareholders' Equity
So, based on the above formula, the ROE for NCAB Group is:
30% = kr404m ÷ kr1.3b (Based on the trailing twelve months to December 2023).
The 'return' is the income the business earned over the last year. So, this means that for every SEK1 of its shareholder's investments, the company generates a profit of SEK0.30.
What Is The Relationship Between ROE And Earnings Growth?
Thus far, we have learned that ROE measures how efficiently a company is generating its profits. Depending on how much of these profits the company reinvests or "retains", and how effectively it does so, we are then able to assess a company’s earnings growth potential. Assuming all else is equal, companies that have both a higher return on equity and higher profit retention are usually the ones that have a higher growth rate when compared to companies that don't have the same features.
A Side By Side comparison of NCAB Group's Earnings Growth And 30% ROE
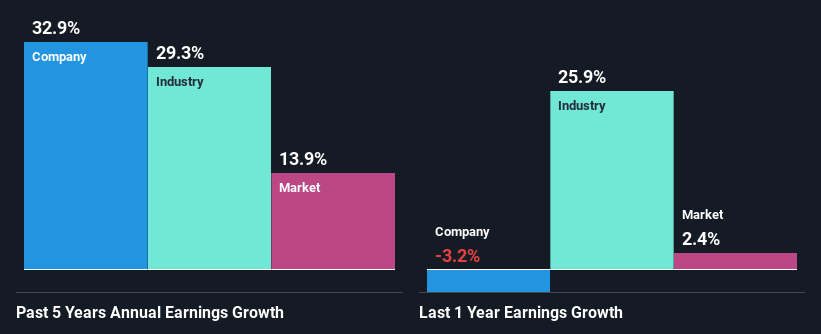
First thing first, we like that NCAB Group has an impressive ROE. Second, a comparison with the average ROE reported by the industry of 18% also doesn't go unnoticed by us. So, the substantial 33% net income growth seen by NCAB Group over the past five years isn't overly surprising.
As a next step, we compared NCAB Group's net income growth with the industry and found that the company has a similar growth figure when compared with the industry average growth rate of 29% in the same period.
Earnings growth is an important metric to consider when valuing a stock. It’s important for an investor to know whether the market has priced in the company's expected earnings growth (or decline). Doing so will help them establish if the stock's future looks promising or ominous. Is NCAB Group fairly valued compared to other companies? These 3 valuation measures might help you decide.
Is NCAB Group Using Its Retained Earnings Effectively?
The three-year median payout ratio for NCAB Group is 47%, which is moderately low. The company is retaining the remaining 53%. So it seems that NCAB Group is reinvesting efficiently in a way that it sees impressive growth in its earnings (discussed above) and pays a dividend that's well covered.
Moreover, NCAB Group is determined to keep sharing its profits with shareholders which we infer from its long history of five years of paying a dividend. Based on the latest analysts' estimates, we found that the company's future payout ratio over the next three years is expected to hold steady at 50%. Therefore, the company's future ROE is also not expected to change by much with analysts predicting an ROE of 27%.
Conclusion
In total, we are pretty happy with NCAB Group's performance. Specifically, we like that the company is reinvesting a huge chunk of its profits at a high rate of return. This of course has caused the company to see substantial growth in its earnings. That being so, a study of the latest analyst forecasts show that the company is expected to see a slowdown in its future earnings growth. To know more about the latest analysts predictions for the company, check out this visualization of analyst forecasts for the company.
Valuation is complex, but we're helping make it simple.
Find out whether NCAB Group is potentially over or undervalued by checking out our comprehensive analysis, which includes fair value estimates, risks and warnings, dividends, insider transactions and financial health.
View the Free AnalysisHave feedback on this article? Concerned about the content? Get in touch with us directly. Alternatively, email editorial-team (at) simplywallst.com.
This article by Simply Wall St is general in nature. We provide commentary based on historical data and analyst forecasts only using an unbiased methodology and our articles are not intended to be financial advice. It does not constitute a recommendation to buy or sell any stock, and does not take account of your objectives, or your financial situation. We aim to bring you long-term focused analysis driven by fundamental data. Note that our analysis may not factor in the latest price-sensitive company announcements or qualitative material. Simply Wall St has no position in any stocks mentioned.
About OM:NCAB
NCAB Group
NCAB Group AB (publ) manufactures and sells printed circuit boards (PCBs) in Sweden, Nordic region, rest of Europe, North America, and Asia.
Excellent balance sheet with reasonable growth potential.

