Investors ignore increasing losses at Greater Than (STO:GREAT) as stock jumps 17% this past week


The most you can lose on any stock (assuming you don't use leverage) is 100% of your money. But on the bright side, you can make far more than 100% on a really good stock. One great example is Greater Than AB (STO:GREAT) which saw its share price drive 102% higher over five years. Better yet, the share price has risen 17% in the last week.
Since the stock has added kr134m to its market cap in the past week alone, let's see if underlying performance has been driving long-term returns.
View our latest analysis for Greater Than
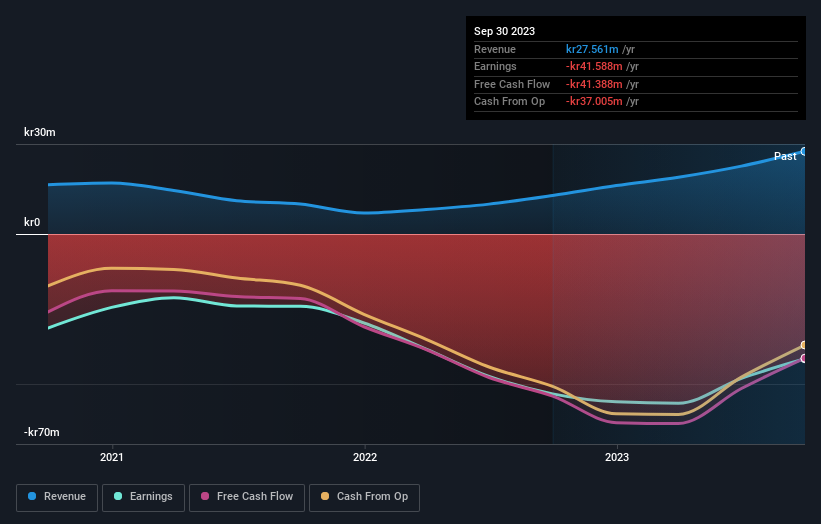
Greater Than wasn't profitable in the last twelve months, it is unlikely we'll see a strong correlation between its share price and its earnings per share (EPS). Arguably revenue is our next best option. Generally speaking, companies without profits are expected to grow revenue every year, and at a good clip. As you can imagine, fast revenue growth, when maintained, often leads to fast profit growth.
Over the last half decade Greater Than's revenue has actually been trending down at about 2.6% per year. Given that scenario, we wouldn't have expected the share price to rise 15% per year, but that's what it did. It's a good reminder that expectations about the future, not the past history, always impact share prices. Still, this situation makes us a little wary of the stock.
You can see below how earnings and revenue have changed over time (discover the exact values by clicking on the image).
Balance sheet strength is crucial. It might be well worthwhile taking a look at our free report on how its financial position has changed over time.
A Different Perspective
Investors in Greater Than had a tough year, with a total loss of 5.6%, against a market gain of about 16%. However, keep in mind that even the best stocks will sometimes underperform the market over a twelve month period. Longer term investors wouldn't be so upset, since they would have made 15%, each year, over five years. If the fundamental data continues to indicate long term sustainable growth, the current sell-off could be an opportunity worth considering. I find it very interesting to look at share price over the long term as a proxy for business performance. But to truly gain insight, we need to consider other information, too. For example, we've discovered 4 warning signs for Greater Than (2 are a bit concerning!) that you should be aware of before investing here.
Of course Greater Than may not be the best stock to buy. So you may wish to see this free collection of growth stocks.
Please note, the market returns quoted in this article reflect the market weighted average returns of stocks that currently trade on Swedish exchanges.
New: Manage All Your Stock Portfolios in One Place
We've created the ultimate portfolio companion for stock investors, and it's free.
• Connect an unlimited number of Portfolios and see your total in one currency
• Be alerted to new Warning Signs or Risks via email or mobile
• Track the Fair Value of your stocks
Have feedback on this article? Concerned about the content? Get in touch with us directly. Alternatively, email editorial-team (at) simplywallst.com.
This article by Simply Wall St is general in nature. We provide commentary based on historical data and analyst forecasts only using an unbiased methodology and our articles are not intended to be financial advice. It does not constitute a recommendation to buy or sell any stock, and does not take account of your objectives, or your financial situation. We aim to bring you long-term focused analysis driven by fundamental data. Note that our analysis may not factor in the latest price-sensitive company announcements or qualitative material. Simply Wall St has no position in any stocks mentioned.
About OM:GREAT
Greater Than
Operates as a driving data analytics company that uses artificial intelligence (AI) to convert GPS data into driver scores that predict crash probability and climate impact.
Adequate balance sheet slight.
