Generic Sweden (STO:GENI) stock performs better than its underlying earnings growth over last five years


For many, the main point of investing in the stock market is to achieve spectacular returns. And we've seen some truly amazing gains over the years. Don't believe it? Then look at the Generic Sweden AB (STO:GENI) share price. It's 664% higher than it was five years ago. If that doesn't get you thinking about long term investing, we don't know what will. On top of that, the share price is up 11% in about a quarter. Anyone who held for that rewarding ride would probably be keen to talk about it.
The past week has proven to be lucrative for Generic Sweden investors, so let's see if fundamentals drove the company's five-year performance.
Check out our latest analysis for Generic Sweden
While the efficient markets hypothesis continues to be taught by some, it has been proven that markets are over-reactive dynamic systems, and investors are not always rational. One way to examine how market sentiment has changed over time is to look at the interaction between a company's share price and its earnings per share (EPS).
Over half a decade, Generic Sweden managed to grow its earnings per share at 35% a year. This EPS growth is lower than the 50% average annual increase in the share price. This suggests that market participants hold the company in higher regard, these days. That's not necessarily surprising considering the five-year track record of earnings growth.
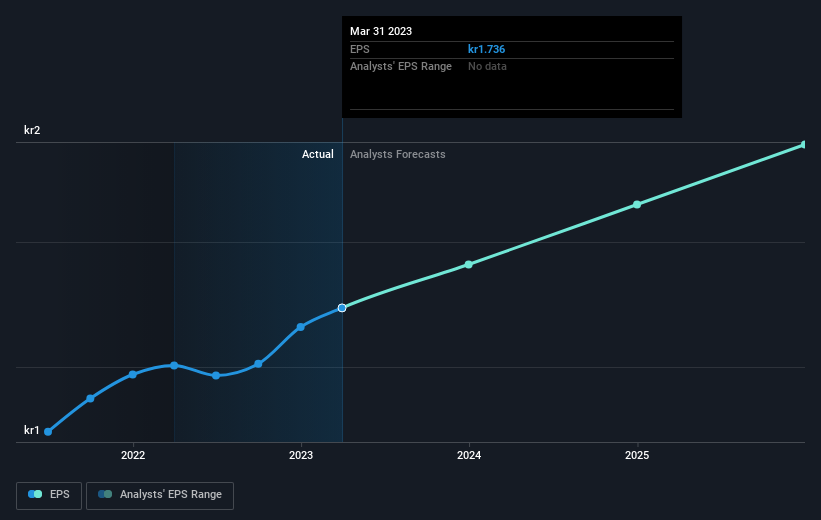
The graphic below depicts how EPS has changed over time (unveil the exact values by clicking on the image).
We know that Generic Sweden has improved its bottom line over the last three years, but what does the future have in store? Take a more thorough look at Generic Sweden's financial health with this free report on its balance sheet.
What About Dividends?
It is important to consider the total shareholder return, as well as the share price return, for any given stock. Whereas the share price return only reflects the change in the share price, the TSR includes the value of dividends (assuming they were reinvested) and the benefit of any discounted capital raising or spin-off. So for companies that pay a generous dividend, the TSR is often a lot higher than the share price return. In the case of Generic Sweden, it has a TSR of 818% for the last 5 years. That exceeds its share price return that we previously mentioned. The dividends paid by the company have thusly boosted the total shareholder return.
A Different Perspective
While the broader market gained around 2.9% in the last year, Generic Sweden shareholders lost 2.6% (even including dividends). Even the share prices of good stocks drop sometimes, but we want to see improvements in the fundamental metrics of a business, before getting too interested. On the bright side, long term shareholders have made money, with a gain of 56% per year over half a decade. It could be that the recent sell-off is an opportunity, so it may be worth checking the fundamental data for signs of a long term growth trend. It's always interesting to track share price performance over the longer term. But to understand Generic Sweden better, we need to consider many other factors. Take risks, for example - Generic Sweden has 3 warning signs (and 1 which is concerning) we think you should know about.
Of course Generic Sweden may not be the best stock to buy. So you may wish to see this free collection of growth stocks.
Please note, the market returns quoted in this article reflect the market weighted average returns of stocks that currently trade on Swedish exchanges.
New: Manage All Your Stock Portfolios in One Place
We've created the ultimate portfolio companion for stock investors, and it's free.
• Connect an unlimited number of Portfolios and see your total in one currency
• Be alerted to new Warning Signs or Risks via email or mobile
• Track the Fair Value of your stocks
Have feedback on this article? Concerned about the content? Get in touch with us directly. Alternatively, email editorial-team (at) simplywallst.com.
This article by Simply Wall St is general in nature. We provide commentary based on historical data and analyst forecasts only using an unbiased methodology and our articles are not intended to be financial advice. It does not constitute a recommendation to buy or sell any stock, and does not take account of your objectives, or your financial situation. We aim to bring you long-term focused analysis driven by fundamental data. Note that our analysis may not factor in the latest price-sensitive company announcements or qualitative material. Simply Wall St has no position in any stocks mentioned.
About OM:GENI
Generic Sweden
A technology company, provides messaging services for all applications.
Flawless balance sheet with reasonable growth potential.
