
Advertisement
BIMobject AB (STO:BIM) Shares May Have Slumped 31% But Getting In Cheap Is Still Unlikely
BIMobject AB (STO:BIM) shares have retraced a considerable 31% in the last month, reversing a fair amount of their solid recent performance. Still, a bad month hasn't completely ruined the past year with the stock gaining 29%, which is great even in a bull market.
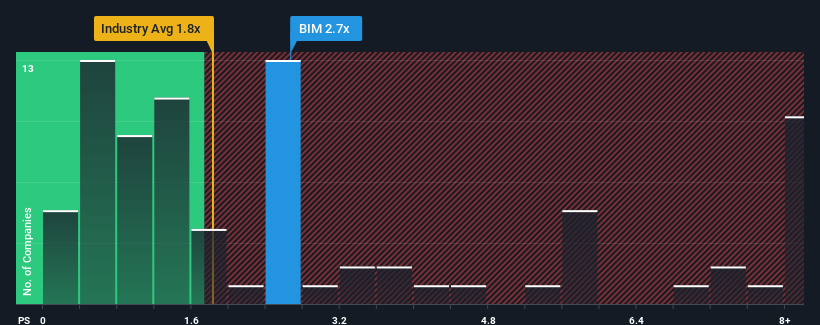
Even after such a large drop in price, given close to half the companies operating in Sweden's Software industry have price-to-sales ratios (or "P/S") below 1.8x, you may still consider BIMobject as a stock to potentially avoid with its 2.7x P/S ratio. Nonetheless, we'd need to dig a little deeper to determine if there is a rational basis for the elevated P/S.
See our latest analysis for BIMobject
What Does BIMobject's Recent Performance Look Like?
The revenue growth achieved at BIMobject over the last year would be more than acceptable for most companies. It might be that many expect the respectable revenue performance to beat most other companies over the coming period, which has increased investors’ willingness to pay up for the stock. However, if this isn't the case, investors might get caught out paying too much for the stock.
Want the full picture on earnings, revenue and cash flow for the company? Then our free report on BIMobject will help you shine a light on its historical performance.What Are Revenue Growth Metrics Telling Us About The High P/S?
There's an inherent assumption that a company should outperform the industry for P/S ratios like BIMobject's to be considered reasonable.
Retrospectively, the last year delivered an exceptional 19% gain to the company's top line. As a result, it also grew revenue by 15% in total over the last three years. Accordingly, shareholders would have probably been satisfied with the medium-term rates of revenue growth.
Comparing that to the industry, which is predicted to deliver 15% growth in the next 12 months, the company's momentum is weaker, based on recent medium-term annualised revenue results.
With this information, we find it concerning that BIMobject is trading at a P/S higher than the industry. It seems most investors are ignoring the fairly limited recent growth rates and are hoping for a turnaround in the company's business prospects. Only the boldest would assume these prices are sustainable as a continuation of recent revenue trends is likely to weigh heavily on the share price eventually.
What Does BIMobject's P/S Mean For Investors?
There's still some elevation in BIMobject's P/S, even if the same can't be said for its share price recently. Typically, we'd caution against reading too much into price-to-sales ratios when settling on investment decisions, though it can reveal plenty about what other market participants think about the company.
The fact that BIMobject currently trades on a higher P/S relative to the industry is an oddity, since its recent three-year growth is lower than the wider industry forecast. Right now we aren't comfortable with the high P/S as this revenue performance isn't likely to support such positive sentiment for long. Unless the recent medium-term conditions improve markedly, it's very challenging to accept these the share price as being reasonable.
We don't want to rain on the parade too much, but we did also find 1 warning sign for BIMobject that you need to be mindful of.
If strong companies turning a profit tickle your fancy, then you'll want to check out this free list of interesting companies that trade on a low P/E (but have proven they can grow earnings).
Valuation is complex, but we're here to simplify it.
Discover if BIMobject might be undervalued or overvalued with our detailed analysis, featuring fair value estimates, potential risks, dividends, insider trades, and its financial condition.
Access Free AnalysisHave feedback on this article? Concerned about the content? Get in touch with us directly. Alternatively, email editorial-team (at) simplywallst.com.
This article by Simply Wall St is general in nature. We provide commentary based on historical data and analyst forecasts only using an unbiased methodology and our articles are not intended to be financial advice. It does not constitute a recommendation to buy or sell any stock, and does not take account of your objectives, or your financial situation. We aim to bring you long-term focused analysis driven by fundamental data. Note that our analysis may not factor in the latest price-sensitive company announcements or qualitative material. Simply Wall St has no position in any stocks mentioned.
About OM:BIM
BIMobject
A software company, engages in the development of cloud solutions and services within building information modelling (BIM) worldwide.
Flawless balance sheet and overvalued.
Market Insights

Advertisement
Community Narratives
The company that turned a verb into a global necessity and basically runs the modern internet, digital ads, smartphones, maps, and AI.
Fair Value US$300.00|7.1% undervalued
OS
Community Contributor
Flowers Foods Pays A Fair Price For Health
Fair Value US$16.12|26.4% undervalued
NV
Community Contributor
TMX Group will thrive with 33.3% profit margin and enduring market moat
Fair Value CA$49.90|0.8% overvalued
LI
Community Contributor
The "Molecular Pencil": Why Beam's Technology is Built to Win
Fair Value US$65.01|65.8% undervalued
DA
Community Contributor