- Sweden
- /
- Life Sciences
- /
- OM:ALIF B
AddLife AB (publ) (STO:ALIF B) Stock Is Going Strong But Fundamentals Look Uncertain: What Lies Ahead ?


AddLife's (STO:ALIF B) stock is up by a considerable 39% over the past three months. But the company's key financial indicators appear to be differing across the board and that makes us question whether or not the company's current share price momentum can be maintained. In this article, we decided to focus on AddLife's ROE.
Return on Equity or ROE is a test of how effectively a company is growing its value and managing investors’ money. Put another way, it reveals the company's success at turning shareholder investments into profits.
Check out our latest analysis for AddLife
How Is ROE Calculated?
Return on equity can be calculated by using the formula:
Return on Equity = Net Profit (from continuing operations) ÷ Shareholders' Equity
So, based on the above formula, the ROE for AddLife is:
2.3% = kr120m ÷ kr5.1b (Based on the trailing twelve months to June 2024).
The 'return' is the profit over the last twelve months. So, this means that for every SEK1 of its shareholder's investments, the company generates a profit of SEK0.02.
What Is The Relationship Between ROE And Earnings Growth?
We have already established that ROE serves as an efficient profit-generating gauge for a company's future earnings. Based on how much of its profits the company chooses to reinvest or "retain", we are then able to evaluate a company's future ability to generate profits. Assuming all else is equal, companies that have both a higher return on equity and higher profit retention are usually the ones that have a higher growth rate when compared to companies that don't have the same features.
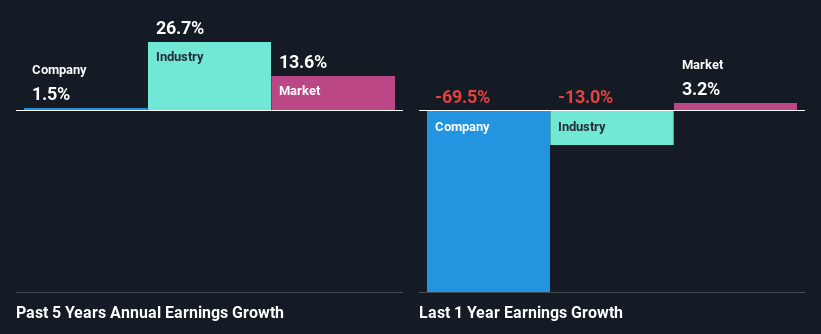
AddLife's Earnings Growth And 2.3% ROE
As you can see, AddLife's ROE looks pretty weak. Even compared to the average industry ROE of 6.6%, the company's ROE is quite dismal. Therefore, AddLife's flat earnings over the past five years can possibly be explained by the low ROE amongst other factors.
We then compared AddLife's net income growth with the industry and found that the company's growth figure is lower than the average industry growth rate of 27% in the same 5-year period, which is a bit concerning.
The basis for attaching value to a company is, to a great extent, tied to its earnings growth. The investor should try to establish if the expected growth or decline in earnings, whichever the case may be, is priced in. This then helps them determine if the stock is placed for a bright or bleak future. Has the market priced in the future outlook for ALIF B? You can find out in our latest intrinsic value infographic research report.
Is AddLife Making Efficient Use Of Its Profits?
In spite of a normal three-year median payout ratio of 34% (or a retention ratio of 66%), AddLife hasn't seen much growth in its earnings. So there could be some other explanation in that regard. For instance, the company's business may be deteriorating.
Additionally, AddLife has paid dividends over a period of seven years, which means that the company's management is determined to pay dividends even if it means little to no earnings growth. Upon studying the latest analysts' consensus data, we found that the company is expected to keep paying out approximately 33% of its profits over the next three years. However, AddLife's ROE is predicted to rise to 9.3% despite there being no anticipated change in its payout ratio.
Conclusion
In total, we're a bit ambivalent about AddLife's performance. While the company does have a high rate of reinvestment, the low ROE means that all that reinvestment is not reaping any benefit to its investors, and moreover, its having a negative impact on the earnings growth. That being so, the latest analyst forecasts show that the company will continue to see an expansion in its earnings. To know more about the latest analysts predictions for the company, check out this visualization of analyst forecasts for the company.
New: Manage All Your Stock Portfolios in One Place
We've created the ultimate portfolio companion for stock investors, and it's free.
• Connect an unlimited number of Portfolios and see your total in one currency
• Be alerted to new Warning Signs or Risks via email or mobile
• Track the Fair Value of your stocks
Have feedback on this article? Concerned about the content? Get in touch with us directly. Alternatively, email editorial-team (at) simplywallst.com.
This article by Simply Wall St is general in nature. We provide commentary based on historical data and analyst forecasts only using an unbiased methodology and our articles are not intended to be financial advice. It does not constitute a recommendation to buy or sell any stock, and does not take account of your objectives, or your financial situation. We aim to bring you long-term focused analysis driven by fundamental data. Note that our analysis may not factor in the latest price-sensitive company announcements or qualitative material. Simply Wall St has no position in any stocks mentioned.
About OM:ALIF B
AddLife
Provides equipment, consumables, and reagents primarily to healthcare sector, research, colleges, and universities, as well as the food and pharmaceutical industries.
Undervalued with reasonable growth potential.

