Stock Analysis
- Sweden
- /
- Entertainment
- /
- OM:EMBRAC B
Swedish High Growth Tech Stocks To Watch

Reviewed by Simply Wall St
Amidst a backdrop of global economic uncertainty and fluctuating market indices, Sweden's tech sector continues to show resilience and potential for high growth. In this article, we will explore three Swedish tech stocks that stand out due to their innovative capabilities and strong market positioning in the current economic climate.
Top 10 High Growth Tech Companies In Sweden
| Name | Revenue Growth | Earnings Growth | Growth Rating |
|---|---|---|---|
| Truecaller | 20.32% | 21.61% | ★★★★★★ |
| Fortnox | 20.18% | 22.60% | ★★★★★★ |
| Xbrane Biopharma | 53.90% | 118.02% | ★★★★★★ |
| Bonesupport Holding | 33.76% | 31.20% | ★★★★★★ |
| Scandion Oncology | 40.71% | 75.34% | ★★★★★★ |
| Hemnet Group | 20.13% | 25.41% | ★★★★★★ |
| Skolon | 31.76% | 121.72% | ★★★★★★ |
| BioArctic | 42.38% | 98.40% | ★★★★★★ |
| Yubico | 20.43% | 42.51% | ★★★★★★ |
| KebNi | 34.75% | 86.11% | ★★★★★★ |
We'll examine a selection from our screener results.
BioArctic (OM:BIOA B)
Simply Wall St Growth Rating: ★★★★★★
Overview: BioArctic AB (publ) develops biological drugs for patients with disorders of the central nervous system in Sweden and has a market cap of SEK16.08 billion.
Operations: BioArctic AB focuses on developing biological drugs targeting central nervous system disorders. Its primary revenue stream is derived from biotechnology, generating SEK299.35 million.
BioArctic's revenue is projected to grow at 42.4% annually, significantly outpacing the Swedish market's 1% growth rate. Despite a net loss of SEK 68.43 million in Q2 2024, this marks an improvement from the previous year's SEK 102.31 million loss. The company's earnings are forecasted to increase by an impressive 98.4% per year, driven by advancements such as exidavnemab and collaborations with Eisai on Alzheimer's treatments like Leqembi®. With R&D expenses reflecting a strong commitment to innovation, BioArctic is positioned for substantial future growth in biotech and pharmaceuticals.
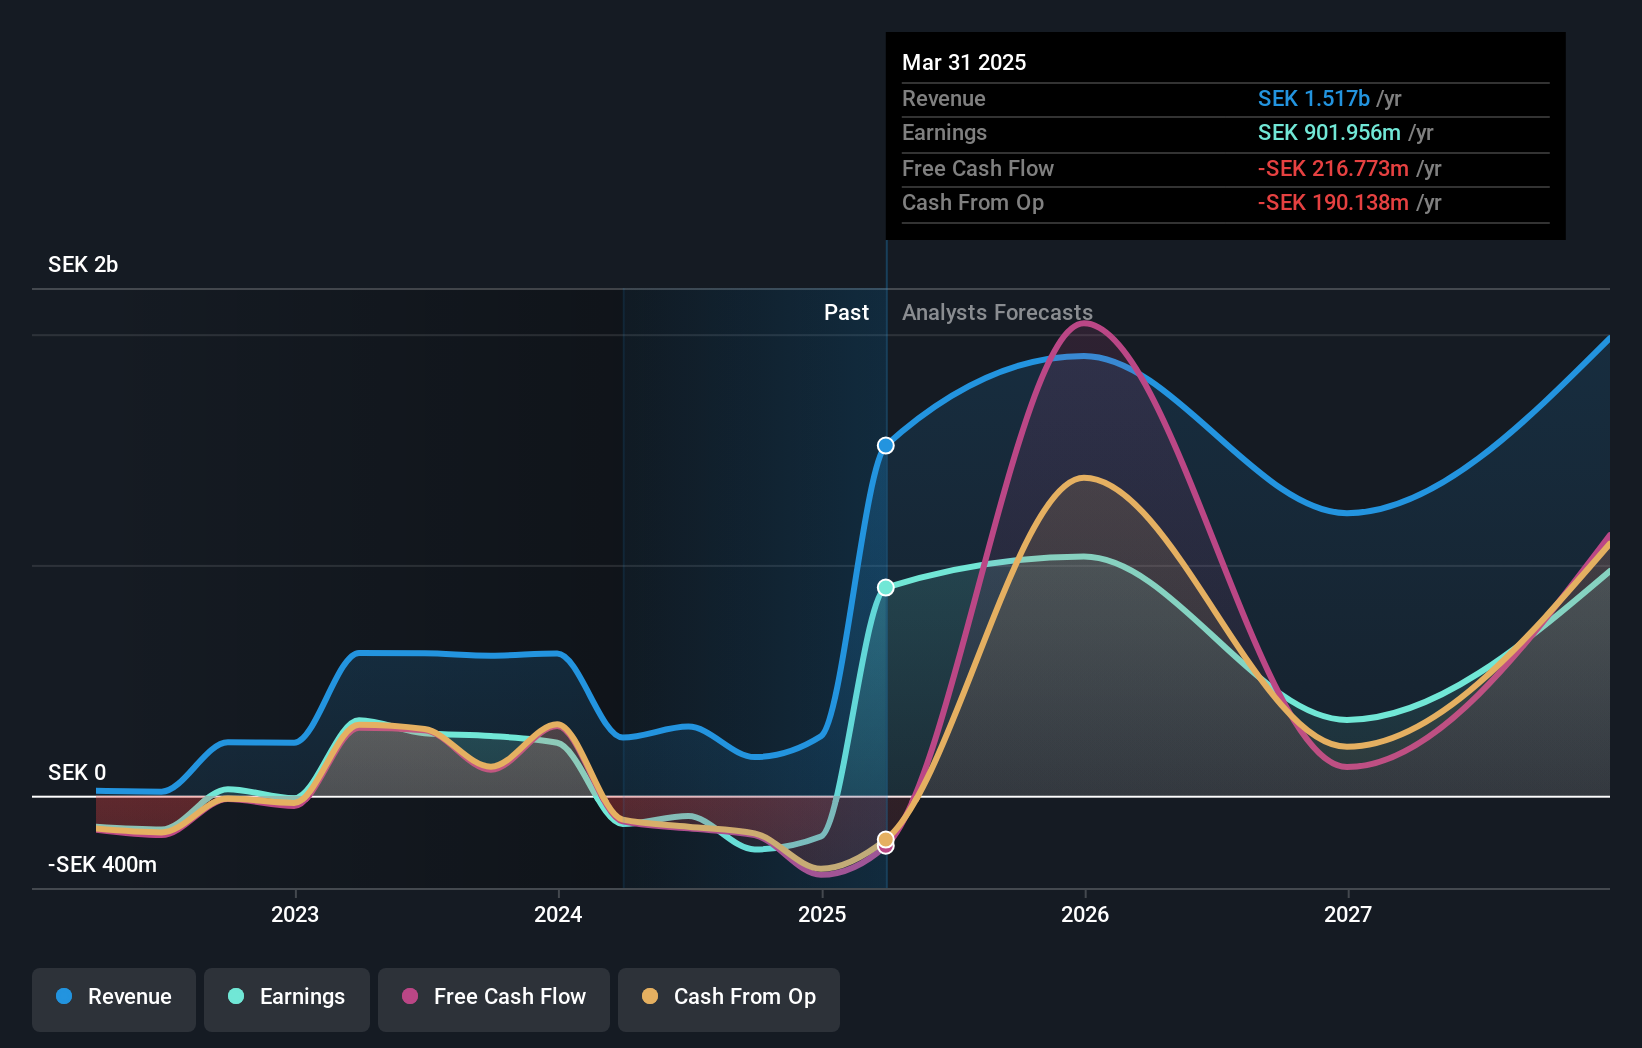
Embracer Group (OM:EMBRAC B)
Simply Wall St Growth Rating: ★★★★☆☆
Overview: Embracer Group AB (publ), along with its subsidiaries, develops and publishes PC, console, mobile, VR, and board games for the global market and has a market cap of SEK33.13 billion.
Operations: The company generates revenue primarily from PC/console games (SEK13.10 billion), tabletop games (SEK14.65 billion), mobile games (SEK5.87 billion), and entertainment & services (SEK6.13 billion).
Embracer Group, a major player in the gaming industry, has faced recent financial challenges with a net loss of SEK 2.18 billion in Q1 2024 compared to a net income of SEK 2.25 billion the previous year. Despite this, their forecasted earnings growth stands at an impressive 106.1% per year, indicating strong future potential. The company also invests heavily in R&D, allocating significant resources to innovation and development within its diverse portfolio of gaming studios and intellectual properties.
- Unlock comprehensive insights into our analysis of Embracer Group stock in this health report.
Understand Embracer Group's track record by examining our Past report.

Vitrolife (OM:VITR)
Simply Wall St Growth Rating: ★★★★☆☆
Overview: Vitrolife AB (publ) specializes in providing assisted reproduction products and has a market cap of SEK34.25 billion.
Operations: Vitrolife AB (publ) generates revenue through three primary segments: Genetics (SEK1.25 billion), Consumables (SEK1.57 billion), and Technologies (SEK708 million).
Vitrolife's recent performance highlights a robust growth trajectory, with Q2 2024 sales reaching SEK 941 million, up from SEK 905 million the previous year. Net income surged to SEK 143 million from SEK 106 million. The company's earnings are forecasted to grow by an impressive 105.81% annually, driven by advancements in its life sciences segment. Despite a volatile share price and unprofitable status, Vitrolife’s R&D expenditure underscores its commitment to innovation within the biotech industry.
- Click here to discover the nuances of Vitrolife with our detailed analytical health report.
Evaluate Vitrolife's historical performance by accessing our past performance report.

Seize The Opportunity
- Delve into our full catalog of 81 Swedish High Growth Tech and AI Stocks here.
- Are these companies part of your investment strategy? Use Simply Wall St to consolidate your holdings into a portfolio and gain insights with our comprehensive analysis tools.
- Streamline your investment strategy with Simply Wall St's app for free and benefit from extensive research on stocks across all corners of the world.
Ready For A Different Approach?
- Explore high-performing small cap companies that haven't yet garnered significant analyst attention.
- Fuel your portfolio with companies showing strong growth potential, backed by optimistic outlooks both from analysts and management.
- Find companies with promising cash flow potential yet trading below their fair value.
This article by Simply Wall St is general in nature. We provide commentary based on historical data and analyst forecasts only using an unbiased methodology and our articles are not intended to be financial advice. It does not constitute a recommendation to buy or sell any stock, and does not take account of your objectives, or your financial situation. We aim to bring you long-term focused analysis driven by fundamental data. Note that our analysis may not factor in the latest price-sensitive company announcements or qualitative material. Simply Wall St has no position in any stocks mentioned.
Valuation is complex, but we're here to simplify it.
Discover if Embracer Group might be undervalued or overvalued with our detailed analysis, featuring fair value estimates, potential risks, dividends, insider trades, and its financial condition.
Access Free AnalysisHave feedback on this article? Concerned about the content? Get in touch with us directly. Alternatively, email editorial-team@simplywallst.com
About OM:EMBRAC B
Embracer Group
Develops and publishes PC, console, mobile, VR, and board games for the games market worldwide.
