- Sweden
- /
- Metals and Mining
- /
- OM:PROF B
The 29% return delivered to ProfilGruppen's (STO:PROF B) shareholders actually lagged YoY earnings growth


By buying an index fund, you can roughly match the market return with ease. But if you choose individual stocks with prowess, you can make superior returns. Just take a look at ProfilGruppen AB (publ) (STO:PROF B), which is up 16%, over three years, soundly beating the market return of 10% (not including dividends). However, more recent returns haven't been as impressive as that, with the stock returning just 16% in the last year , including dividends .
The past week has proven to be lucrative for ProfilGruppen investors, so let's see if fundamentals drove the company's three-year performance.
See our latest analysis for ProfilGruppen
In his essay The Superinvestors of Graham-and-Doddsville Warren Buffett described how share prices do not always rationally reflect the value of a business. By comparing earnings per share (EPS) and share price changes over time, we can get a feel for how investor attitudes to a company have morphed over time.
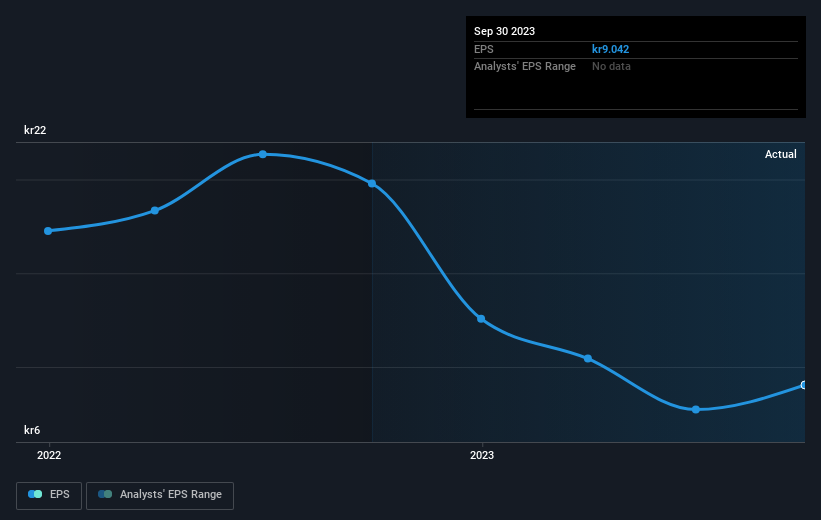
ProfilGruppen was able to grow its EPS at 31% per year over three years, sending the share price higher. The average annual share price increase of 5% is actually lower than the EPS growth. So one could reasonably conclude that the market has cooled on the stock. We'd venture the lowish P/E ratio of 11.90 also reflects the negative sentiment around the stock.
You can see below how EPS has changed over time (discover the exact values by clicking on the image).
It's good to see that there was some significant insider buying in the last three months. That's a positive. On the other hand, we think the revenue and earnings trends are much more meaningful measures of the business. Dive deeper into the earnings by checking this interactive graph of ProfilGruppen's earnings, revenue and cash flow.
What About Dividends?
It is important to consider the total shareholder return, as well as the share price return, for any given stock. The TSR is a return calculation that accounts for the value of cash dividends (assuming that any dividend received was reinvested) and the calculated value of any discounted capital raisings and spin-offs. It's fair to say that the TSR gives a more complete picture for stocks that pay a dividend. As it happens, ProfilGruppen's TSR for the last 3 years was 29%, which exceeds the share price return mentioned earlier. This is largely a result of its dividend payments!
A Different Perspective
ProfilGruppen provided a TSR of 16% over the year (including dividends). That's fairly close to the broader market return. That gain looks pretty satisfying, and it is even better than the five-year TSR of 4% per year. It is possible that management foresight will bring growth well into the future, even if the share price slows down. While it is well worth considering the different impacts that market conditions can have on the share price, there are other factors that are even more important. To that end, you should be aware of the 3 warning signs we've spotted with ProfilGruppen .
If you like to buy stocks alongside management, then you might just love this free list of companies. (Hint: insiders have been buying them).
Please note, the market returns quoted in this article reflect the market weighted average returns of stocks that currently trade on Swedish exchanges.
New: Manage All Your Stock Portfolios in One Place
We've created the ultimate portfolio companion for stock investors, and it's free.
• Connect an unlimited number of Portfolios and see your total in one currency
• Be alerted to new Warning Signs or Risks via email or mobile
• Track the Fair Value of your stocks
Have feedback on this article? Concerned about the content? Get in touch with us directly. Alternatively, email editorial-team (at) simplywallst.com.
This article by Simply Wall St is general in nature. We provide commentary based on historical data and analyst forecasts only using an unbiased methodology and our articles are not intended to be financial advice. It does not constitute a recommendation to buy or sell any stock, and does not take account of your objectives, or your financial situation. We aim to bring you long-term focused analysis driven by fundamental data. Note that our analysis may not factor in the latest price-sensitive company announcements or qualitative material. Simply Wall St has no position in any stocks mentioned.
About OM:PROF B
ProfilGruppen
Designs, develops, manufactures, and markets customized aluminum components and extrusions primarily in Europe.
Flawless balance sheet with solid track record and pays a dividend.
