- Sweden
- /
- Paper and Forestry Products
- /
- OM:HOLM B
Does This Valuation Of Holmen AB (publ) (STO:HOLM B) Imply Investors Are Overpaying?


Key Insights
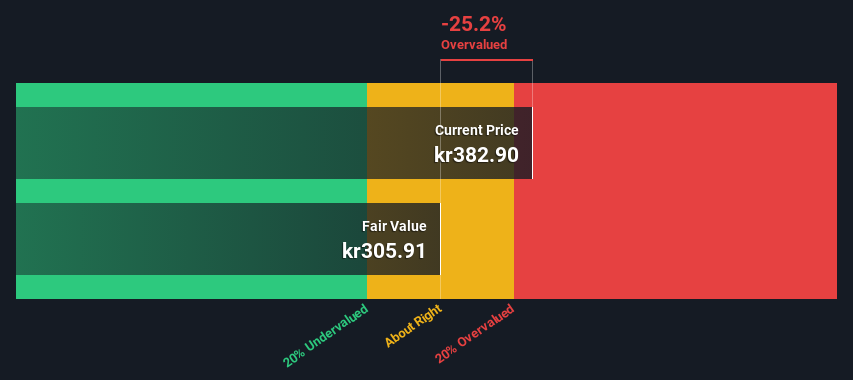
- The projected fair value for Holmen is kr306 based on 2 Stage Free Cash Flow to Equity
- Current share price of kr383 suggests Holmen is potentially 25% overvalued
- Analyst price target for HOLM B is kr430, which is 40% above our fair value estimate
How far off is Holmen AB (publ) (STO:HOLM B) from its intrinsic value? Using the most recent financial data, we'll take a look at whether the stock is fairly priced by taking the expected future cash flows and discounting them to today's value. One way to achieve this is by employing the Discounted Cash Flow (DCF) model. Models like these may appear beyond the comprehension of a lay person, but they're fairly easy to follow.
Companies can be valued in a lot of ways, so we would point out that a DCF is not perfect for every situation. If you still have some burning questions about this type of valuation, take a look at the Simply Wall St analysis model.
Check out our latest analysis for Holmen
The Model
We use what is known as a 2-stage model, which simply means we have two different periods of growth rates for the company's cash flows. Generally the first stage is higher growth, and the second stage is a lower growth phase. In the first stage we need to estimate the cash flows to the business over the next ten years. Where possible we use analyst estimates, but when these aren't available we extrapolate the previous free cash flow (FCF) from the last estimate or reported value. We assume companies with shrinking free cash flow will slow their rate of shrinkage, and that companies with growing free cash flow will see their growth rate slow, over this period. We do this to reflect that growth tends to slow more in the early years than it does in later years.
Generally we assume that a dollar today is more valuable than a dollar in the future, so we need to discount the sum of these future cash flows to arrive at a present value estimate:
10-year free cash flow (FCF) forecast
| 2024 | 2025 | 2026 | 2027 | 2028 | 2029 | 2030 | 2031 | 2032 | 2033 | |
| Levered FCF (SEK, Millions) | kr3.44b | kr3.79b | kr3.65b | kr3.56b | kr3.51b | kr3.48b | kr3.46b | kr3.46b | kr3.47b | kr3.48b |
| Growth Rate Estimate Source | Analyst x4 | Analyst x3 | Est @ -3.72% | Est @ -2.40% | Est @ -1.48% | Est @ -0.84% | Est @ -0.38% | Est @ -0.07% | Est @ 0.15% | Est @ 0.31% |
| Present Value (SEK, Millions) Discounted @ 7.4% | kr3.2k | kr3.3k | kr2.9k | kr2.7k | kr2.4k | kr2.3k | kr2.1k | kr1.9k | kr1.8k | kr1.7k |
("Est" = FCF growth rate estimated by Simply Wall St)
Present Value of 10-year Cash Flow (PVCF) = kr24b
The second stage is also known as Terminal Value, this is the business's cash flow after the first stage. The Gordon Growth formula is used to calculate Terminal Value at a future annual growth rate equal to the 5-year average of the 10-year government bond yield of 0.7%. We discount the terminal cash flows to today's value at a cost of equity of 7.4%.
Terminal Value (TV)= FCF2033 × (1 + g) ÷ (r – g) = kr3.5b× (1 + 0.7%) ÷ (7.4%– 0.7%) = kr52b
Present Value of Terminal Value (PVTV)= TV / (1 + r)10= kr52b÷ ( 1 + 7.4%)10= kr25b
The total value, or equity value, is then the sum of the present value of the future cash flows, which in this case is kr50b. To get the intrinsic value per share, we divide this by the total number of shares outstanding. Compared to the current share price of kr383, the company appears slightly overvalued at the time of writing. Remember though, that this is just an approximate valuation, and like any complex formula - garbage in, garbage out.
The Assumptions
The calculation above is very dependent on two assumptions. The first is the discount rate and the other is the cash flows. Part of investing is coming up with your own evaluation of a company's future performance, so try the calculation yourself and check your own assumptions. The DCF also does not consider the possible cyclicality of an industry, or a company's future capital requirements, so it does not give a full picture of a company's potential performance. Given that we are looking at Holmen as potential shareholders, the cost of equity is used as the discount rate, rather than the cost of capital (or weighted average cost of capital, WACC) which accounts for debt. In this calculation we've used 7.4%, which is based on a levered beta of 1.355. Beta is a measure of a stock's volatility, compared to the market as a whole. We get our beta from the industry average beta of globally comparable companies, with an imposed limit between 0.8 and 2.0, which is a reasonable range for a stable business.
SWOT Analysis for Holmen
- Earnings growth over the past year exceeded the industry.
- Debt is not viewed as a risk.
- Dividends are covered by earnings and cash flows.
- Dividend is low compared to the top 25% of dividend payers in the Forestry market.
- Expensive based on P/E ratio and estimated fair value.
- HOLM B's financial characteristics indicate limited near-term opportunities for shareholders.
- Annual earnings are forecast to decline for the next 3 years.
Moving On:
Although the valuation of a company is important, it is only one of many factors that you need to assess for a company. DCF models are not the be-all and end-all of investment valuation. Instead the best use for a DCF model is to test certain assumptions and theories to see if they would lead to the company being undervalued or overvalued. For example, changes in the company's cost of equity or the risk free rate can significantly impact the valuation. What is the reason for the share price exceeding the intrinsic value? For Holmen, there are three relevant elements you should further examine:
- Risks: As an example, we've found 2 warning signs for Holmen (1 doesn't sit too well with us!) that you need to consider before investing here.
- Management:Have insiders been ramping up their shares to take advantage of the market's sentiment for HOLM B's future outlook? Check out our management and board analysis with insights on CEO compensation and governance factors.
- Other Solid Businesses: Low debt, high returns on equity and good past performance are fundamental to a strong business. Why not explore our interactive list of stocks with solid business fundamentals to see if there are other companies you may not have considered!
PS. Simply Wall St updates its DCF calculation for every Swedish stock every day, so if you want to find the intrinsic value of any other stock just search here.
Valuation is complex, but we're here to simplify it.
Discover if Holmen might be undervalued or overvalued with our detailed analysis, featuring fair value estimates, potential risks, dividends, insider trades, and its financial condition.
Access Free AnalysisHave feedback on this article? Concerned about the content? Get in touch with us directly. Alternatively, email editorial-team (at) simplywallst.com.
This article by Simply Wall St is general in nature. We provide commentary based on historical data and analyst forecasts only using an unbiased methodology and our articles are not intended to be financial advice. It does not constitute a recommendation to buy or sell any stock, and does not take account of your objectives, or your financial situation. We aim to bring you long-term focused analysis driven by fundamental data. Note that our analysis may not factor in the latest price-sensitive company announcements or qualitative material. Simply Wall St has no position in any stocks mentioned.
About OM:HOLM B
Holmen
Engages in forest, paperboard, paper, wood products, and renewable energy businesses in Sweden and internationally.
Excellent balance sheet second-rate dividend payer.

