- Sweden
- /
- Healthcare Services
- /
- OM:HEGR
Hedera Group Full Year 2023 Earnings: EPS: kr0.64 (vs kr1.03 in FY 2022)


Hedera Group (STO:HEGR) Full Year 2023 Results
Key Financial Results
- Revenue: kr679.1m (up 50% from FY 2022).
- Net income: kr9.50m (down 30% from FY 2022).
- Profit margin: 1.4% (down from 3.0% in FY 2022). The decrease in margin was driven by higher expenses.
- EPS: kr0.64 (down from kr1.03 in FY 2022).
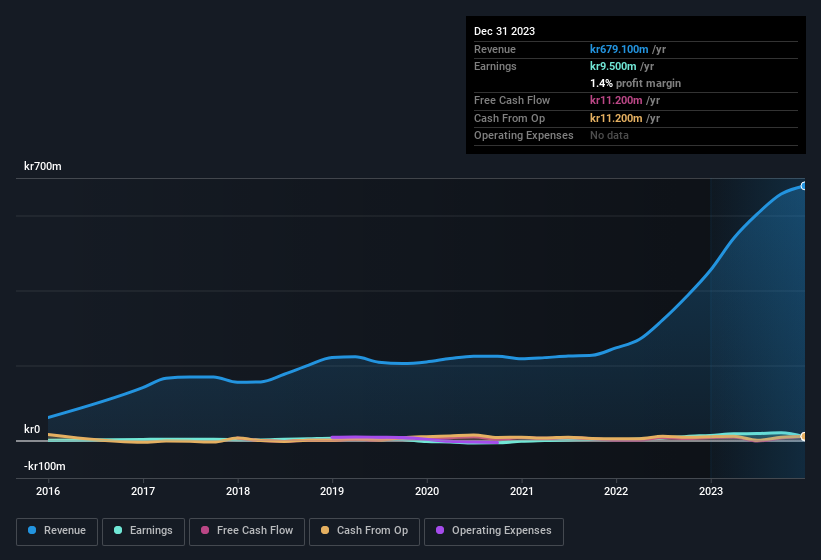
All figures shown in the chart above are for the trailing 12 month (TTM) period
Hedera Group shares are down 17% from a week ago.
Risk Analysis
We don't want to rain on the parade too much, but we did also find 2 warning signs for Hedera Group (1 is a bit concerning!) that you need to be mindful of.
Valuation is complex, but we're here to simplify it.
Discover if Hedera Group might be undervalued or overvalued with our detailed analysis, featuring fair value estimates, potential risks, dividends, insider trades, and its financial condition.
Access Free AnalysisHave feedback on this article? Concerned about the content? Get in touch with us directly. Alternatively, email editorial-team (at) simplywallst.com.
This article by Simply Wall St is general in nature. We provide commentary based on historical data and analyst forecasts only using an unbiased methodology and our articles are not intended to be financial advice. It does not constitute a recommendation to buy or sell any stock, and does not take account of your objectives, or your financial situation. We aim to bring you long-term focused analysis driven by fundamental data. Note that our analysis may not factor in the latest price-sensitive company announcements or qualitative material. Simply Wall St has no position in any stocks mentioned.
About OM:HEGR
Hedera Group
Provides personal assistance, staffing, and recruitment services for healthcare and social care sectors in Sweden.
Excellent balance sheet and fair value.
