- Sweden
- /
- Capital Markets
- /
- OM:MANG
Mangold Fondkommission (STO:MANG) delivers shareholders fantastic 33% CAGR over 5 years, surging 12% in the last week alone


The worst result, after buying shares in a company (assuming no leverage), would be if you lose all the money you put in. But when you pick a company that is really flourishing, you can make more than 100%. One great example is Mangold Fondkommission AB (STO:MANG) which saw its share price drive 297% higher over five years. And in the last week the share price has popped 12%.
Since it's been a strong week for Mangold Fondkommission shareholders, let's have a look at trend of the longer term fundamentals.
Check out our latest analysis for Mangold Fondkommission
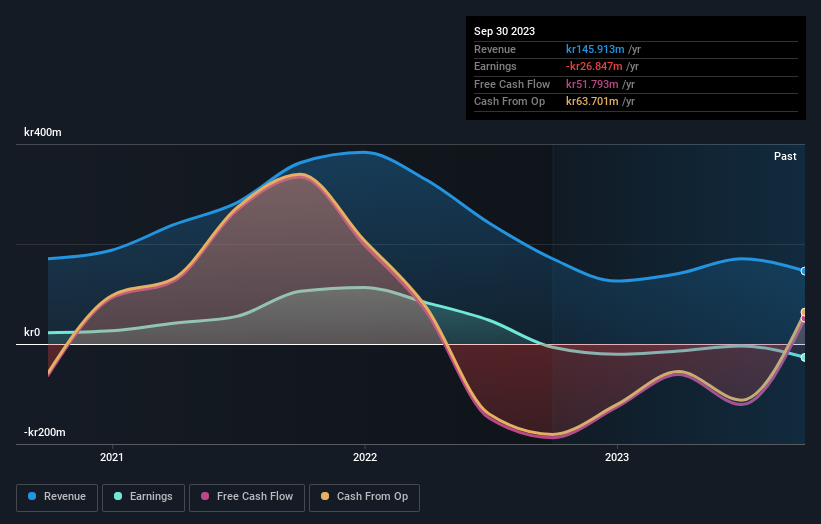
Given that Mangold Fondkommission didn't make a profit in the last twelve months, we'll focus on revenue growth to form a quick view of its business development. When a company doesn't make profits, we'd generally expect to see good revenue growth. That's because it's hard to be confident a company will be sustainable if revenue growth is negligible, and it never makes a profit.
In the last 5 years Mangold Fondkommission saw its revenue grow at 7.5% per year. That's a fairly respectable growth rate. Broadly speaking, this solid progress may well be reflected by the healthy share price gain of 32% per year over five years. Given that the business has made good progress on the top line, it would be worth taking a look at the growth trend. Accelerating growth can be a sign of an inflection point - and could indicate profits lie ahead. Worth watching 100%
The image below shows how earnings and revenue have tracked over time (if you click on the image you can see greater detail).
We consider it positive that insiders have made significant purchases in the last year. Having said that, most people consider earnings and revenue growth trends to be a more meaningful guide to the business. Before buying or selling a stock, we always recommend a close examination of historic growth trends, available here..
What About The Total Shareholder Return (TSR)?
We'd be remiss not to mention the difference between Mangold Fondkommission's total shareholder return (TSR) and its share price return. Arguably the TSR is a more complete return calculation because it accounts for the value of dividends (as if they were reinvested), along with the hypothetical value of any discounted capital that have been offered to shareholders. Dividends have been really beneficial for Mangold Fondkommission shareholders, and that cash payout contributed to why its TSR of 311%, over the last 5 years, is better than the share price return.
A Different Perspective
While the broader market gained around 6.5% in the last year, Mangold Fondkommission shareholders lost 17%. Even the share prices of good stocks drop sometimes, but we want to see improvements in the fundamental metrics of a business, before getting too interested. On the bright side, long term shareholders have made money, with a gain of 33% per year over half a decade. It could be that the recent sell-off is an opportunity, so it may be worth checking the fundamental data for signs of a long term growth trend. It's always interesting to track share price performance over the longer term. But to understand Mangold Fondkommission better, we need to consider many other factors. Case in point: We've spotted 1 warning sign for Mangold Fondkommission you should be aware of.
If you like to buy stocks alongside management, then you might just love this free list of companies. (Hint: insiders have been buying them).
Please note, the market returns quoted in this article reflect the market weighted average returns of stocks that currently trade on Swedish exchanges.
New: Manage All Your Stock Portfolios in One Place
We've created the ultimate portfolio companion for stock investors, and it's free.
• Connect an unlimited number of Portfolios and see your total in one currency
• Be alerted to new Warning Signs or Risks via email or mobile
• Track the Fair Value of your stocks
Have feedback on this article? Concerned about the content? Get in touch with us directly. Alternatively, email editorial-team (at) simplywallst.com.
This article by Simply Wall St is general in nature. We provide commentary based on historical data and analyst forecasts only using an unbiased methodology and our articles are not intended to be financial advice. It does not constitute a recommendation to buy or sell any stock, and does not take account of your objectives, or your financial situation. We aim to bring you long-term focused analysis driven by fundamental data. Note that our analysis may not factor in the latest price-sensitive company announcements or qualitative material. Simply Wall St has no position in any stocks mentioned.
About OM:MANG
Mangold Fondkommission
Provides financial services to companies, institutions, and private individuals in Sweden.
Flawless balance sheet and overvalued.
