Stock Analysis
- Sweden
- /
- Professional Services
- /
- OM:NJOB
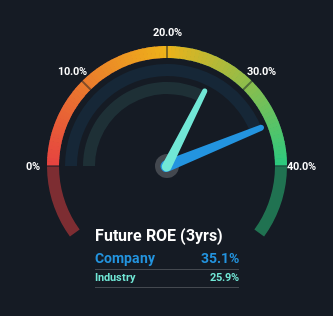
NetJobs Group AB (publ) (STO:NJOB) Delivered A Better ROE Than Its Industry

While some investors are already well versed in financial metrics (hat tip), this article is for those who would like to learn about Return On Equity (ROE) and why it is important. By way of learning-by-doing, we'll look at ROE to gain a better understanding of NetJobs Group AB (publ) (STO:NJOB).
Return on Equity or ROE is a test of how effectively a company is growing its value and managing investors’ money. In short, ROE shows the profit each dollar generates with respect to its shareholder investments.
See our latest analysis for NetJobs Group
How To Calculate Return On Equity?
The formula for return on equity is:
Return on Equity = Net Profit (from continuing operations) ÷ Shareholders' Equity
So, based on the above formula, the ROE for NetJobs Group is:
35% = kr831k ÷ kr2.4m (Based on the trailing twelve months to September 2023).
The 'return' is the yearly profit. So, this means that for every SEK1 of its shareholder's investments, the company generates a profit of SEK0.35.
Does NetJobs Group Have A Good Return On Equity?
Arguably the easiest way to assess company's ROE is to compare it with the average in its industry. However, this method is only useful as a rough check, because companies do differ quite a bit within the same industry classification. Pleasingly, NetJobs Group has a superior ROE than the average (26%) in the Professional Services industry.
That's clearly a positive. Bear in mind, a high ROE doesn't always mean superior financial performance. Aside from changes in net income, a high ROE can also be the outcome of high debt relative to equity, which indicates risk. Our risks dashboardshould have the 4 risks we have identified for NetJobs Group.
How Does Debt Impact ROE?
Virtually all companies need money to invest in the business, to grow profits. The cash for investment can come from prior year profits (retained earnings), issuing new shares, or borrowing. In the first and second cases, the ROE will reflect this use of cash for investment in the business. In the latter case, the debt used for growth will improve returns, but won't affect the total equity. In this manner the use of debt will boost ROE, even though the core economics of the business stay the same.
NetJobs Group's Debt And Its 35% ROE
NetJobs Group clearly uses a high amount of debt to boost returns, as it has a debt to equity ratio of 1.44. There's no doubt the ROE is impressive, but it's worth keeping in mind that the metric could have been lower if the company were to reduce its debt. Debt does bring extra risk, so it's only really worthwhile when a company generates some decent returns from it.
Conclusion
Return on equity is a useful indicator of the ability of a business to generate profits and return them to shareholders. In our books, the highest quality companies have high return on equity, despite low debt. All else being equal, a higher ROE is better.
Having said that, while ROE is a useful indicator of business quality, you'll have to look at a whole range of factors to determine the right price to buy a stock. The rate at which profits are likely to grow, relative to the expectations of profit growth reflected in the current price, must be considered, too. So I think it may be worth checking this free this detailed graph of past earnings, revenue and cash flow.
But note: NetJobs Group may not be the best stock to buy. So take a peek at this free list of interesting companies with high ROE and low debt.
Valuation is complex, but we're helping make it simple.
Find out whether NetJobs Group is potentially over or undervalued by checking out our comprehensive analysis, which includes fair value estimates, risks and warnings, dividends, insider transactions and financial health.
View the Free AnalysisHave feedback on this article? Concerned about the content? Get in touch with us directly. Alternatively, email editorial-team (at) simplywallst.com.
This article by Simply Wall St is general in nature. We provide commentary based on historical data and analyst forecasts only using an unbiased methodology and our articles are not intended to be financial advice. It does not constitute a recommendation to buy or sell any stock, and does not take account of your objectives, or your financial situation. We aim to bring you long-term focused analysis driven by fundamental data. Note that our analysis may not factor in the latest price-sensitive company announcements or qualitative material. Simply Wall St has no position in any stocks mentioned.
About OM:NJOB
NetJobs Group
NetJobs Group AB (publ) owns and operates digital platforms and services for job advertising and employer branding primarily in Sweden, Germany, and internationally.
Slightly overvalued with imperfect balance sheet.

