Advertisement
Is Trelleborg’s Share Price Justified After Its Latest 6.5% Jump?

Simply Wall St
Reviewed by Simply Wall St
If you are weighing the next move for Trelleborg stock, you are not alone. The company’s shares have had their fair share of ups and downs lately, giving investors reason to pause and take a closer look. After some short-term choppiness, Trelleborg has pulled off a tidy 6.5% gain over the last month, and is up 1.3% just this past week. That may sound impressive, especially compared to the nearly flat performance over the past year. However, zoom out a little, and the long-term picture really comes into focus. Over the last three years, the stock has climbed 86.0%, and if you held on for five years, you are looking at a staggering 157.1% return. Of course, with such strong historical growth, questions inevitably come up: is the stock still attractively valued, or have investors run ahead of fundamentals?
That is where a structured valuation review comes in. We have put Trelleborg through six classic valuation checks and, as it stands, the company is undervalued in two of them, giving it a current value score of 2 out of 6. While that means there are some hints of potential opportunity, it is hardly a slam dunk, at least on the surface.
So, how do these individual valuation checks stack up, and what do they truly tell us about whether Trelleborg is a buy, a hold, or something else? Let us dig deeper into the numbers, and later, I will share the one approach to valuation that can offer an even broader perspective for long-term investors.
Trelleborg scores just 2/6 on our valuation checks. See what other red flags we found in the full valuation breakdown.Approach 1: Trelleborg Discounted Cash Flow (DCF) Analysis
The Discounted Cash Flow (DCF) model estimates a company’s intrinsic value by forecasting its future cash flows and discounting them back to today’s value. This approach helps investors understand what the business is fundamentally worth based on its own cash generation, rather than just its current market price.
For Trelleborg, current Free Cash Flow (FCF) stands at approximately SEK 3.38 billion. Analysts project that by 2027, annual FCF could reach SEK 4.69 billion, with projections extending to over SEK 5.26 billion by 2035. While analysts only formally estimate FCF growth for the next five years, further projections are extrapolated using trends and reasonable long-term assumptions. All values are presented in Swedish Kronor (SEK).
With these cash flows discounted back to today, the DCF model arrives at an estimated fair value of SEK 430.53 per share. Compared to the current market price, this reflects an implied discount of around 13.0%. In other words, the stock appears to be trading below what the DCF model considers its intrinsic value. This suggests some room for upside.
Result: UNDERVALUED
Head to the Valuation section of our Company Report for more details on how we arrive at this Fair Value for Trelleborg.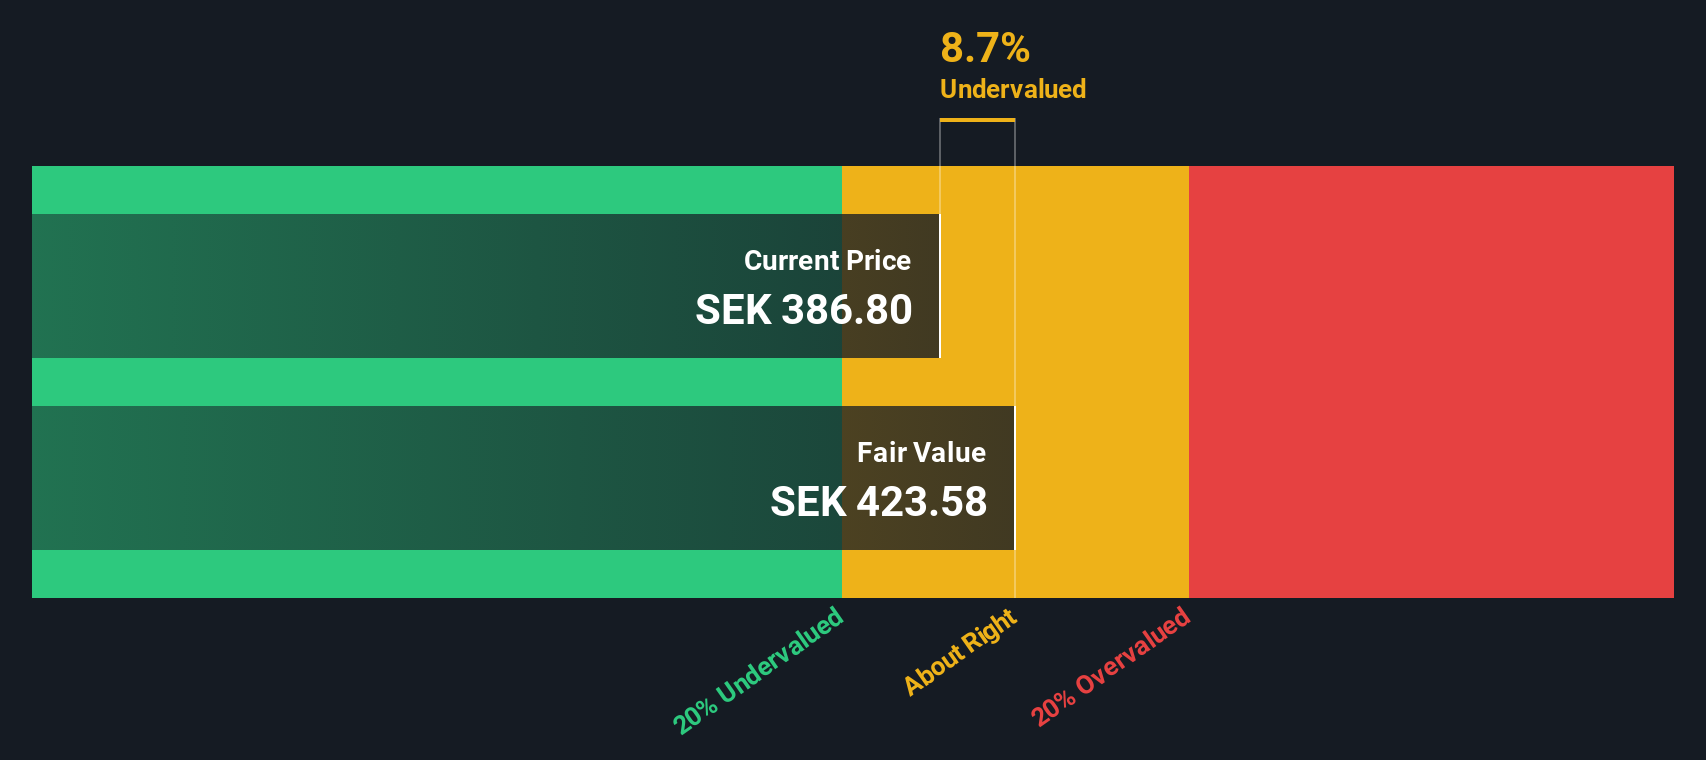
Approach 2: Trelleborg Price vs Earnings (PE)
For profitable companies like Trelleborg, the Price-to-Earnings (PE) ratio offers a useful shortcut for comparing market value against earnings power. The PE ratio is especially relevant for established businesses where profits are predictable and less prone to wild swings, making it easier to benchmark with others in the sector.
However, a company’s “normal” PE ratio is shaped by expectations for future growth and the risks it faces. Stronger growth or lower risks usually justify a higher PE, while slower growth or greater uncertainty lead to a lower one. That is why just looking at the headline number is not enough; context matters.
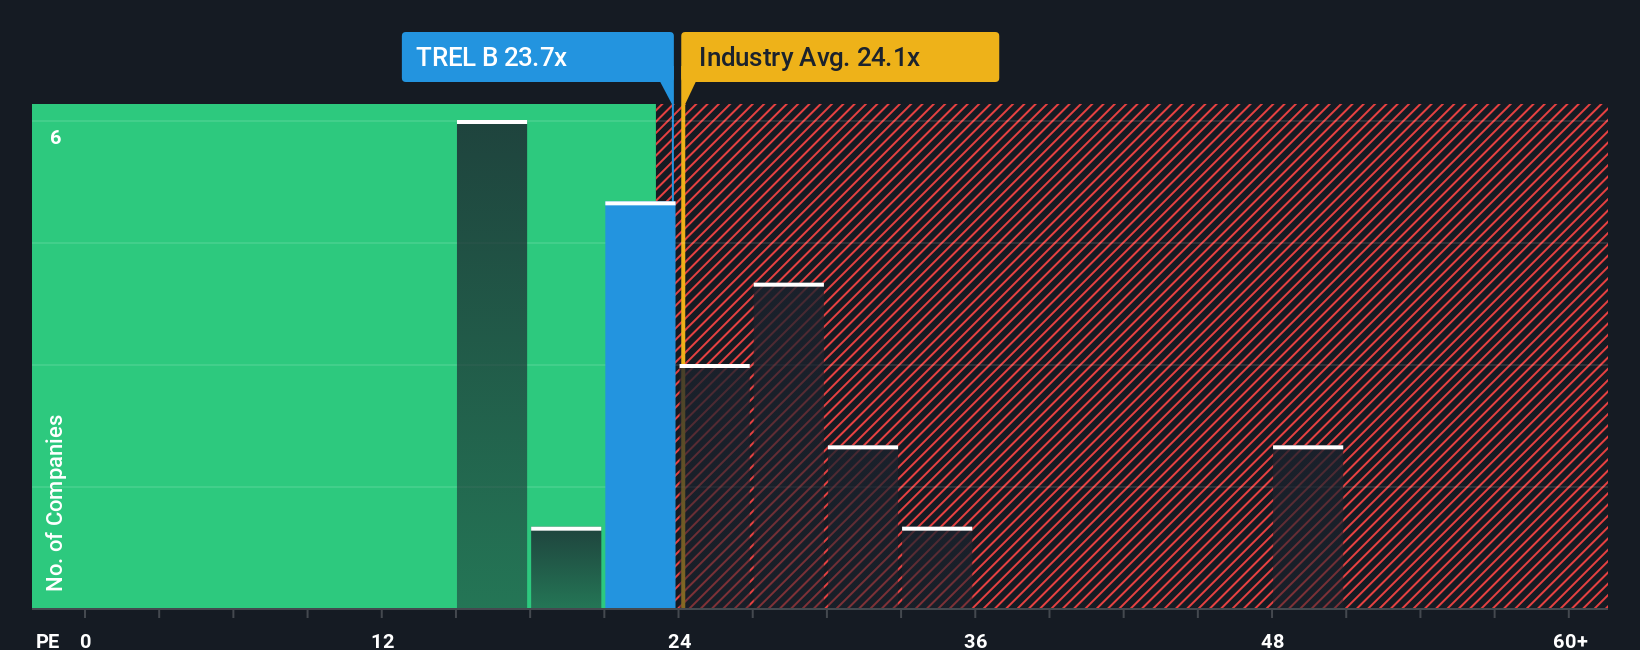
Trelleborg currently trades at a PE ratio of 23.4x. This compares closely with its peer group average of 23.9x and the broader Machinery industry average of 24.6x. But raw comparisons like these only go so far.
That brings us to Simply Wall St’s proprietary Fair Ratio, which blends earnings growth, industry trends, profit margin, company size and specific risks into an integrated benchmark. Unlike simple peer or industry comparisons, the Fair Ratio is tailored to how Trelleborg should be valued based on its own financial characteristics and outlook.
For Trelleborg, the Fair Ratio calculates to 23.2x. With the current market PE at 23.4x, valuation sits almost exactly where it should be. Investors appear to be paying a fair price given the company’s prospects and risk profile.
Result: ABOUT RIGHT
Upgrade Your Decision Making: Choose your Trelleborg Narrative
Earlier we mentioned that there is an even better way to understand valuation, so let us introduce you to Narratives. A Narrative is simply the story you believe about Trelleborg’s future, translated into numbers like projected revenue growth, profit margins, and ultimately a fair value target. Instead of relying just on ratios or static models, Narratives link that underlying story to specific financial forecasts and then show you if the current price looks attractive or not, based on your outlook.
This approach is easy and accessible on Simply Wall St’s Community page, where millions of investors build and share Narratives for every stock. It helps you see your own reasoning clearly and compare different perspectives side by side, making it easier to decide when to buy, hold, or sell. Narratives are dynamic, so when new information arrives such as earnings, sector news, or company updates, your fair value is automatically refreshed based on your story and assumptions.
For Trelleborg, for example, one user’s bullish Narrative might see strong growth from green energy and project a fair value of SEK 430 per share, while a more cautious investor could highlight risks in the automotive sector and set a fair value closer to SEK 350.
Do you think there's more to the story for Trelleborg? Create your own Narrative to let the Community know!
This article by Simply Wall St is general in nature. We provide commentary based on historical data and analyst forecasts only using an unbiased methodology and our articles are not intended to be financial advice. It does not constitute a recommendation to buy or sell any stock, and does not take account of your objectives, or your financial situation. We aim to bring you long-term focused analysis driven by fundamental data. Note that our analysis may not factor in the latest price-sensitive company announcements or qualitative material. Simply Wall St has no position in any stocks mentioned.
Valuation is complex, but we're here to simplify it.
Discover if Trelleborg might be undervalued or overvalued with our detailed analysis, featuring fair value estimates, potential risks, dividends, insider trades, and its financial condition.
Access Free AnalysisHave feedback on this article? Concerned about the content? Get in touch with us directly. Alternatively, email editorial-team@simplywallst.com
About OM:TREL B
Trelleborg
Provides engineered polymer solutions for seal, damp, and protect critical applications worldwide.
Flawless balance sheet with proven track record and pays a dividend.
Similar Companies
Market Insights

Advertisement
Community Narratives
The "Molecular Pencil": Why Beam's Technology is Built to Win
Fair Value US$65.01|65.4% undervalued
DA
Community Contributor
The silent giant behind virtually every advanced chip powering AI, smartphones, and modern infrastructure.
Fair Value US$310.00|6.1% undervalued
OS
Community Contributor
ADP Stock: Solid Fundamentals, But AI Investments Test Its Margin Resilience
Fair Value US$387.77|34.2% undervalued
YI
Community Contributor
MINISO's fair value is projected at 26.69 with an anticipated PE ratio shift of 20x
Fair Value US$24.03|9.6% undervalued
BE
Community Contributor