
Advertisement
- Sweden
- /
- Electrical
- /
- OM:AQ
AQ Group (STO:AQ) sheds 9.4% this week, as yearly returns fall more in line with earnings growth
We think all investors should try to buy and hold high quality multi-year winners. While the best companies are hard to find, but they can generate massive returns over long periods. For example, the AQ Group AB (publ) (STO:AQ) share price is up a whopping 306% in the last half decade, a handsome return for long term holders. This just goes to show the value creation that some businesses can achieve. Unfortunately, though, the stock has dropped 9.4% over a week. But note that the broader market is down 2.0% since last week, and this may have impacted AQ Group's share price.
Since the long term performance has been good but there's been a recent pullback of 9.4%, let's check if the fundamentals match the share price.
While the efficient markets hypothesis continues to be taught by some, it has been proven that markets are over-reactive dynamic systems, and investors are not always rational. One flawed but reasonable way to assess how sentiment around a company has changed is to compare the earnings per share (EPS) with the share price.
During five years of share price growth, AQ Group achieved compound earnings per share (EPS) growth of 20% per year. This EPS growth is slower than the share price growth of 32% per year, over the same period. This suggests that market participants hold the company in higher regard, these days. That's not necessarily surprising considering the five-year track record of earnings growth.
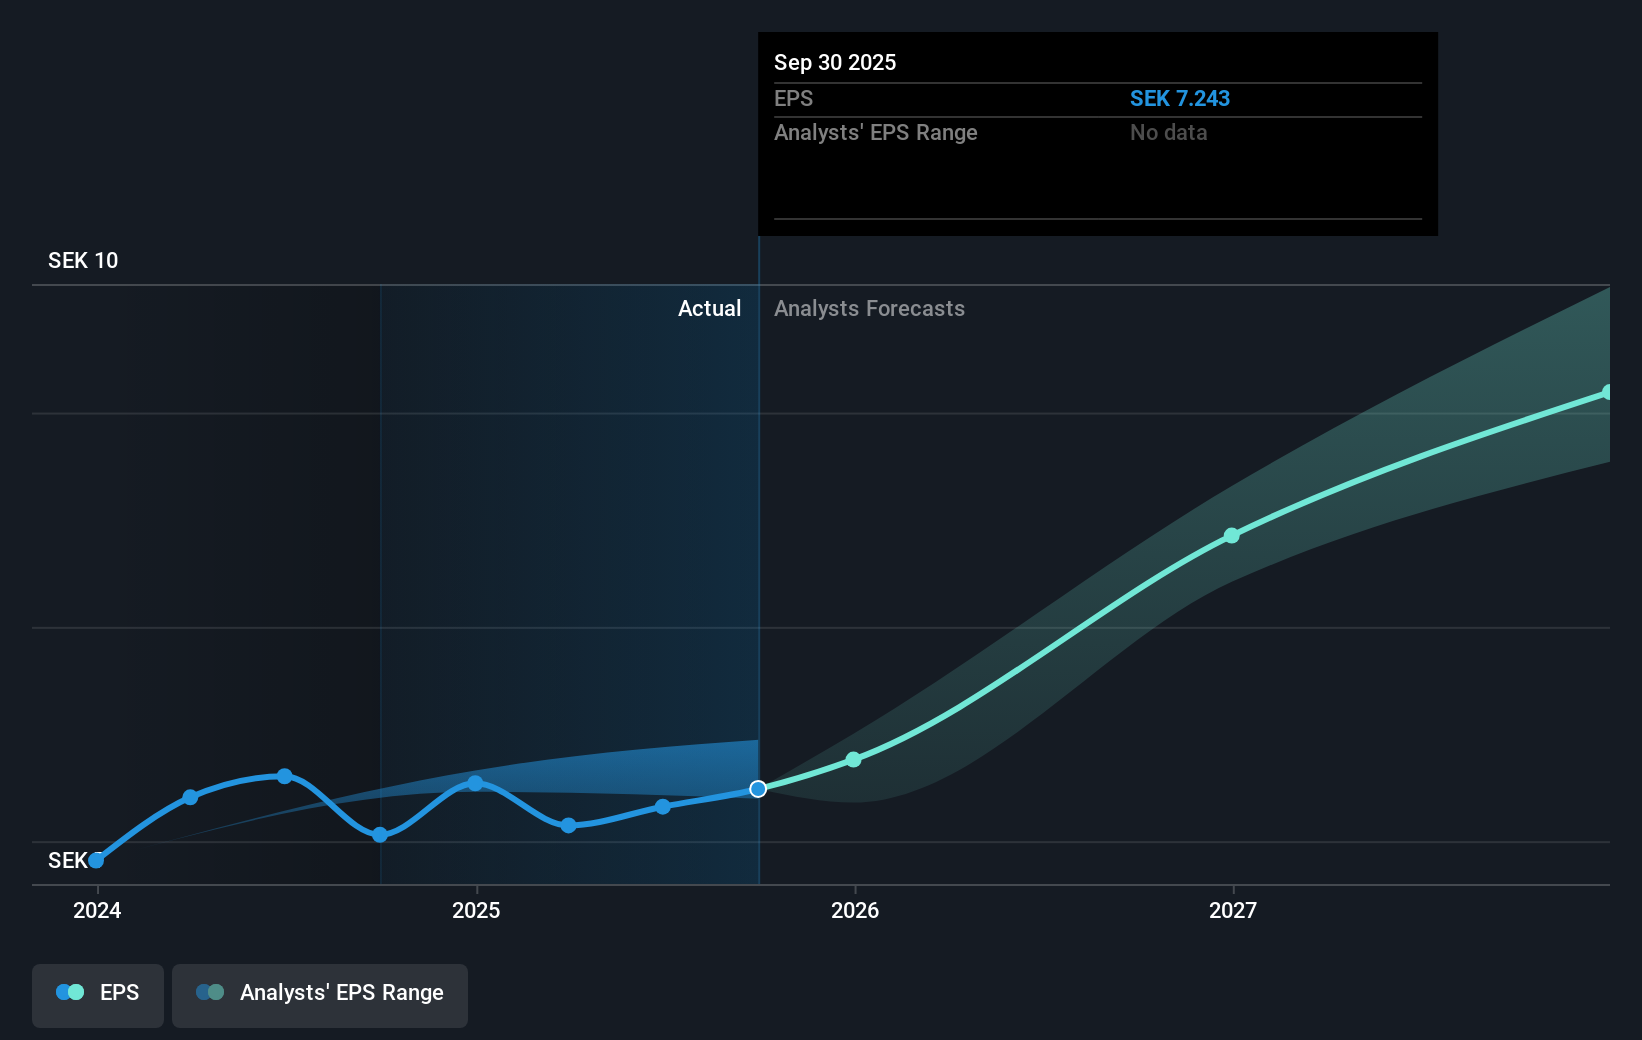
The image below shows how EPS has tracked over time (if you click on the image you can see greater detail).
We're pleased to report that the CEO is remunerated more modestly than most CEOs at similarly capitalized companies. But while CEO remuneration is always worth checking, the really important question is whether the company can grow earnings going forward. This free interactive report on AQ Group's earnings, revenue and cash flow is a great place to start, if you want to investigate the stock further.
What About Dividends?
It is important to consider the total shareholder return, as well as the share price return, for any given stock. The TSR incorporates the value of any spin-offs or discounted capital raisings, along with any dividends, based on the assumption that the dividends are reinvested. So for companies that pay a generous dividend, the TSR is often a lot higher than the share price return. As it happens, AQ Group's TSR for the last 5 years was 323%, which exceeds the share price return mentioned earlier. And there's no prize for guessing that the dividend payments largely explain the divergence!
A Different Perspective
We're pleased to report that AQ Group shareholders have received a total shareholder return of 21% over one year. And that does include the dividend. However, that falls short of the 33% TSR per annum it has made for shareholders, each year, over five years. Potential buyers might understandably feel they've missed the opportunity, but it's always possible business is still firing on all cylinders. If you would like to research AQ Group in more detail then you might want to take a look at whether insiders have been buying or selling shares in the company.
Of course AQ Group may not be the best stock to buy. So you may wish to see this free collection of growth stocks.
Please note, the market returns quoted in this article reflect the market weighted average returns of stocks that currently trade on Swedish exchanges.
New: Manage All Your Stock Portfolios in One Place
We've created the ultimate portfolio companion for stock investors, and it's free.
• Connect an unlimited number of Portfolios and see your total in one currency
• Be alerted to new Warning Signs or Risks via email or mobile
• Track the Fair Value of your stocks
Have feedback on this article? Concerned about the content? Get in touch with us directly. Alternatively, email editorial-team (at) simplywallst.com.
This article by Simply Wall St is general in nature. We provide commentary based on historical data and analyst forecasts only using an unbiased methodology and our articles are not intended to be financial advice. It does not constitute a recommendation to buy or sell any stock, and does not take account of your objectives, or your financial situation. We aim to bring you long-term focused analysis driven by fundamental data. Note that our analysis may not factor in the latest price-sensitive company announcements or qualitative material. Simply Wall St has no position in any stocks mentioned.
About OM:AQ
AQ Group
Develops, manufactures, and assembles components and systems for industrial customers in Sweden, Finland, Germany, the United States of America, China, France, Poland, Italy, the Netherlands, India, Canada, and internationally.
Flawless balance sheet with acceptable track record.
Similar Companies
Market Insights

Advertisement
Community Narratives
The company that turned a verb into a global necessity and basically runs the modern internet, digital ads, smartphones, maps, and AI.
Fair Value US$300.00|7.1% undervalued
OS
Community Contributor
Flowers Foods Pays A Fair Price For Health
Fair Value US$16.12|26.4% undervalued
NV
Community Contributor
TMX Group will thrive with 33.3% profit margin and enduring market moat
Fair Value CA$49.90|0.8% overvalued
LI
Community Contributor
The "Molecular Pencil": Why Beam's Technology is Built to Win
Fair Value US$65.01|65.8% undervalued
DA
Community Contributor