- Saudi Arabia
- /
- Basic Materials
- /
- SASE:2090
Pulling back 13% this week, National Gypsum's TADAWUL:2090) five-year decline in earnings may be coming into investors focus

National Gypsum Company (TADAWUL:2090) shareholders might be concerned after seeing the share price drop 20% in the last quarter. But that doesn't change the fact that the returns over the last five years have been pleasing. It has returned a market beating 88% in that time. Unfortunately not all shareholders will have held it for five years, so spare a thought for those caught in the 57% decline over the last three years: that's a long time to wait for profits.
While this past week has detracted from the company's five-year return, let's look at the recent trends of the underlying business and see if the gains have been in alignment.
Check out our latest analysis for National Gypsum
There is no denying that markets are sometimes efficient, but prices do not always reflect underlying business performance. One flawed but reasonable way to assess how sentiment around a company has changed is to compare the earnings per share (EPS) with the share price.
During the last half decade, National Gypsum became profitable. That would generally be considered a positive, so we'd hope to see the share price to rise.
You can see how EPS has changed over time in the image below (click on the chart to see the exact values).
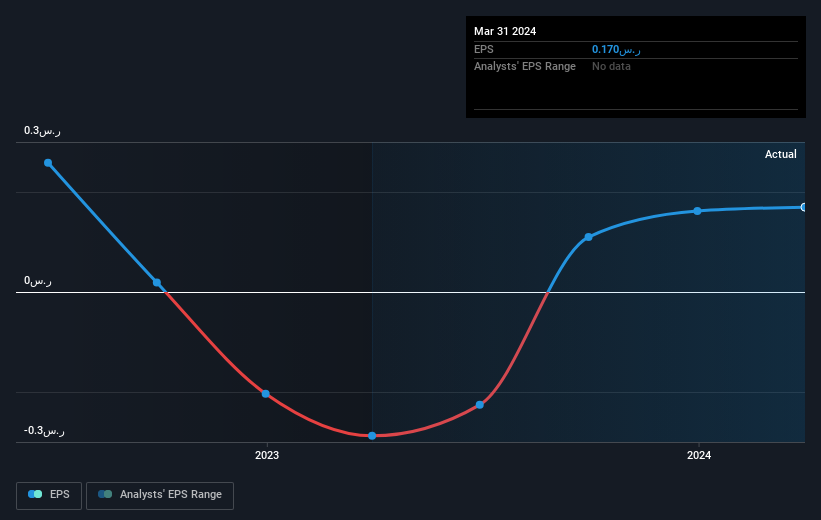
Dive deeper into National Gypsum's key metrics by checking this interactive graph of National Gypsum's earnings, revenue and cash flow.
What About Dividends?
As well as measuring the share price return, investors should also consider the total shareholder return (TSR). Whereas the share price return only reflects the change in the share price, the TSR includes the value of dividends (assuming they were reinvested) and the benefit of any discounted capital raising or spin-off. So for companies that pay a generous dividend, the TSR is often a lot higher than the share price return. As it happens, National Gypsum's TSR for the last 5 years was 97%, which exceeds the share price return mentioned earlier. And there's no prize for guessing that the dividend payments largely explain the divergence!
A Different Perspective
We regret to report that National Gypsum shareholders are down 10.0% for the year (even including dividends). Unfortunately, that's worse than the broader market decline of 7.4%. However, it could simply be that the share price has been impacted by broader market jitters. It might be worth keeping an eye on the fundamentals, in case there's a good opportunity. Longer term investors wouldn't be so upset, since they would have made 15%, each year, over five years. It could be that the recent sell-off is an opportunity, so it may be worth checking the fundamental data for signs of a long term growth trend. It's always interesting to track share price performance over the longer term. But to understand National Gypsum better, we need to consider many other factors. For example, we've discovered 1 warning sign for National Gypsum that you should be aware of before investing here.
Of course, you might find a fantastic investment by looking elsewhere. So take a peek at this free list of companies we expect will grow earnings.
Please note, the market returns quoted in this article reflect the market weighted average returns of stocks that currently trade on Saudi exchanges.
Valuation is complex, but we're here to simplify it.
Discover if National Gypsum might be undervalued or overvalued with our detailed analysis, featuring fair value estimates, potential risks, dividends, insider trades, and its financial condition.
Access Free AnalysisHave feedback on this article? Concerned about the content? Get in touch with us directly. Alternatively, email editorial-team (at) simplywallst.com.
This article by Simply Wall St is general in nature. We provide commentary based on historical data and analyst forecasts only using an unbiased methodology and our articles are not intended to be financial advice. It does not constitute a recommendation to buy or sell any stock, and does not take account of your objectives, or your financial situation. We aim to bring you long-term focused analysis driven by fundamental data. Note that our analysis may not factor in the latest price-sensitive company announcements or qualitative material. Simply Wall St has no position in any stocks mentioned.
Have feedback on this article? Concerned about the content? Get in touch with us directly. Alternatively, email editorial-team@simplywallst.com
About SASE:2090
National Gypsum
Engages in the manufacture and trading of gypsum and its derivatives in the Kingdom of Saudi Arabia.
Flawless balance sheet with questionable track record.

