Stock Analysis
- Saudi Arabia
- /
- Consumer Durables
- /
- SASE:1213
There's Been No Shortage Of Growth Recently For Naseej International Trading's (TADAWUL:1213) Returns On Capital

Finding a business that has the potential to grow substantially is not easy, but it is possible if we look at a few key financial metrics. Amongst other things, we'll want to see two things; firstly, a growing return on capital employed (ROCE) and secondly, an expansion in the company's amount of capital employed. Ultimately, this demonstrates that it's a business that is reinvesting profits at increasing rates of return. With that in mind, we've noticed some promising trends at Naseej International Trading (TADAWUL:1213) so let's look a bit deeper.
Return On Capital Employed (ROCE): What Is It?
For those that aren't sure what ROCE is, it measures the amount of pre-tax profits a company can generate from the capital employed in its business. To calculate this metric for Naseej International Trading, this is the formula:
Return on Capital Employed = Earnings Before Interest and Tax (EBIT) ÷ (Total Assets - Current Liabilities)
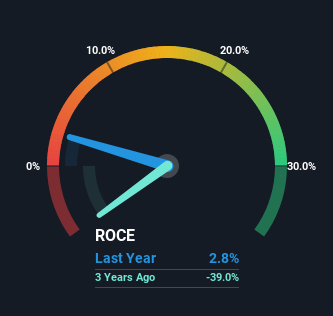
0.028 = ر.س6.5m ÷ (ر.س397m - ر.س163m) (Based on the trailing twelve months to September 2023).
Therefore, Naseej International Trading has an ROCE of 2.8%. Ultimately, that's a low return and it under-performs the Consumer Durables industry average of 8.5%.
See our latest analysis for Naseej International Trading
While the past is not representative of the future, it can be helpful to know how a company has performed historically, which is why we have this chart above. If you want to delve into the historical earnings, revenue and cash flow of Naseej International Trading, check out these free graphs here.
What The Trend Of ROCE Can Tell Us
While there are companies with higher returns on capital out there, we still find the trend at Naseej International Trading promising. The figures show that over the last five years, ROCE has grown 236% whilst employing roughly the same amount of capital. So our take on this is that the business has increased efficiencies to generate these higher returns, all the while not needing to make any additional investments. The company is doing well in that sense, and it's worth investigating what the management team has planned for long term growth prospects.
One more thing to note, Naseej International Trading has decreased current liabilities to 41% of total assets over this period, which effectively reduces the amount of funding from suppliers or short-term creditors. This tells us that Naseej International Trading has grown its returns without a reliance on increasing their current liabilities, which we're very happy with. However, current liabilities are still at a pretty high level, so just be aware that this can bring with it some risks.
The Bottom Line
To bring it all together, Naseej International Trading has done well to increase the returns it's generating from its capital employed. And with the stock having performed exceptionally well over the last five years, these patterns are being accounted for by investors. Therefore, we think it would be worth your time to check if these trends are going to continue.
On a final note, we've found 1 warning sign for Naseej International Trading that we think you should be aware of.
While Naseej International Trading isn't earning the highest return, check out this free list of companies that are earning high returns on equity with solid balance sheets.
Valuation is complex, but we're helping make it simple.
Find out whether Naseej International Trading is potentially over or undervalued by checking out our comprehensive analysis, which includes fair value estimates, risks and warnings, dividends, insider transactions and financial health.
View the Free AnalysisHave feedback on this article? Concerned about the content? Get in touch with us directly. Alternatively, email editorial-team (at) simplywallst.com.
This article by Simply Wall St is general in nature. We provide commentary based on historical data and analyst forecasts only using an unbiased methodology and our articles are not intended to be financial advice. It does not constitute a recommendation to buy or sell any stock, and does not take account of your objectives, or your financial situation. We aim to bring you long-term focused analysis driven by fundamental data. Note that our analysis may not factor in the latest price-sensitive company announcements or qualitative material. Simply Wall St has no position in any stocks mentioned.
About SASE:1213
Naseej International Trading
Naseej International Trading Company manufactures, imports, exports, wholesales, and retails carpets and rugs in the Kingdom of Saudi Arabia.
Excellent balance sheet and fair value.

