- Saudi Arabia
- /
- Industrials
- /
- SASE:1212
Astra Industrial Group (TADAWUL:1212) jumps 4.5% this week, though earnings growth is still tracking behind five-year shareholder returns


For many, the main point of investing in the stock market is to achieve spectacular returns. While the best companies are hard to find, but they can generate massive returns over long periods. For example, the Astra Industrial Group Company (TADAWUL:1212) share price is up a whopping 458% in the last half decade, a handsome return for long term holders. This just goes to show the value creation that some businesses can achieve. And in the last week the share price has popped 4.5%.
On the back of a solid 7-day performance, let's check what role the company's fundamentals have played in driving long term shareholder returns.
Check out our latest analysis for Astra Industrial Group
There is no denying that markets are sometimes efficient, but prices do not always reflect underlying business performance. One imperfect but simple way to consider how the market perception of a company has shifted is to compare the change in the earnings per share (EPS) with the share price movement.
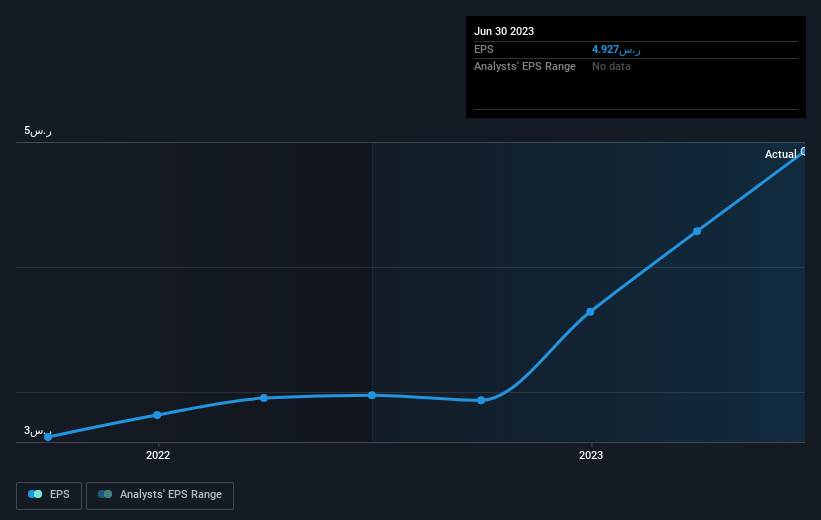
Over half a decade, Astra Industrial Group managed to grow its earnings per share at 40% a year. This EPS growth is remarkably close to the 41% average annual increase in the share price. Therefore one could conclude that sentiment towards the shares hasn't morphed very much. Rather, the share price has approximately tracked EPS growth.
You can see how EPS has changed over time in the image below (click on the chart to see the exact values).
We know that Astra Industrial Group has improved its bottom line over the last three years, but what does the future have in store? Take a more thorough look at Astra Industrial Group's financial health with this free report on its balance sheet.
What About Dividends?
It is important to consider the total shareholder return, as well as the share price return, for any given stock. The TSR is a return calculation that accounts for the value of cash dividends (assuming that any dividend received was reinvested) and the calculated value of any discounted capital raisings and spin-offs. Arguably, the TSR gives a more comprehensive picture of the return generated by a stock. In the case of Astra Industrial Group, it has a TSR of 512% for the last 5 years. That exceeds its share price return that we previously mentioned. And there's no prize for guessing that the dividend payments largely explain the divergence!
A Different Perspective
It's nice to see that Astra Industrial Group shareholders have received a total shareholder return of 69% over the last year. That's including the dividend. Since the one-year TSR is better than the five-year TSR (the latter coming in at 44% per year), it would seem that the stock's performance has improved in recent times. In the best case scenario, this may hint at some real business momentum, implying that now could be a great time to delve deeper. While it is well worth considering the different impacts that market conditions can have on the share price, there are other factors that are even more important. Consider for instance, the ever-present spectre of investment risk. We've identified 1 warning sign with Astra Industrial Group , and understanding them should be part of your investment process.
We will like Astra Industrial Group better if we see some big insider buys. While we wait, check out this free list of growing companies with considerable, recent, insider buying.
Please note, the market returns quoted in this article reflect the market weighted average returns of stocks that currently trade on Saudi exchanges.
New: Manage All Your Stock Portfolios in One Place
We've created the ultimate portfolio companion for stock investors, and it's free.
• Connect an unlimited number of Portfolios and see your total in one currency
• Be alerted to new Warning Signs or Risks via email or mobile
• Track the Fair Value of your stocks
Have feedback on this article? Concerned about the content? Get in touch with us directly. Alternatively, email editorial-team (at) simplywallst.com.
This article by Simply Wall St is general in nature. We provide commentary based on historical data and analyst forecasts only using an unbiased methodology and our articles are not intended to be financial advice. It does not constitute a recommendation to buy or sell any stock, and does not take account of your objectives, or your financial situation. We aim to bring you long-term focused analysis driven by fundamental data. Note that our analysis may not factor in the latest price-sensitive company announcements or qualitative material. Simply Wall St has no position in any stocks mentioned.
About SASE:1212
Astra Industrial Group
Through its subsidiaries, engages in the pharmaceuticals, specialty chemicals, power, steel, and mining businesses worldwide.
Flawless balance sheet with solid track record.

