
Advertisement
- Romania
- /
- Food and Staples Retail
- /
- BVB:CBOT
Not Many Are Piling Into S.C. Comcereal S.A. (BVB:CBOT) Stock Yet As It Plummets 44%
S.C. Comcereal S.A. (BVB:CBOT) shares have had a horrible month, losing 44% after a relatively good period beforehand. Longer-term shareholders will rue the drop in the share price, since it's now virtually flat for the year after a promising few quarters.
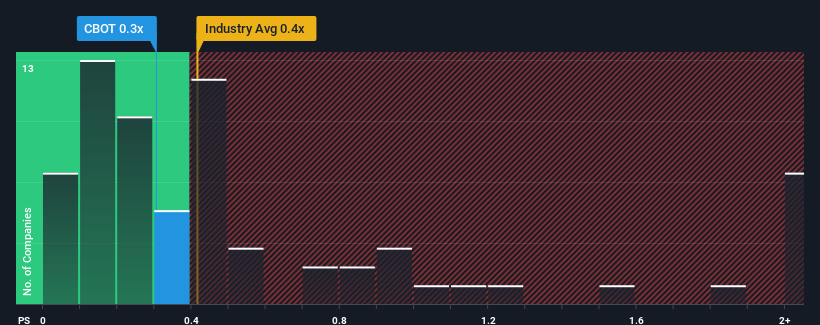
Even after such a large drop in price, S.C. Comcereal may still be sending very bullish signals at the moment with its price-to-sales (or "P/S") ratio of 0.3x, since almost half of all companies in the Consumer Retailing industry in Romania have P/S ratios greater than 3.6x and even P/S higher than 8x are not unusual. Nonetheless, we'd need to dig a little deeper to determine if there is a rational basis for the highly reduced P/S.
View our latest analysis for S.C. Comcereal
What Does S.C. Comcereal's Recent Performance Look Like?
The recent revenue growth at S.C. Comcereal would have to be considered satisfactory if not spectacular. Perhaps the market believes the recent revenue performance might fall short of industry figures in the near future, leading to a reduced P/S. If that doesn't eventuate, then existing shareholders may have reason to be optimistic about the future direction of the share price.
Want the full picture on earnings, revenue and cash flow for the company? Then our free report on S.C. Comcereal will help you shine a light on its historical performance.How Is S.C. Comcereal's Revenue Growth Trending?
In order to justify its P/S ratio, S.C. Comcereal would need to produce anemic growth that's substantially trailing the industry.
Retrospectively, the last year delivered a decent 5.1% gain to the company's revenues. The latest three year period has also seen an excellent 70% overall rise in revenue, aided somewhat by its short-term performance. So we can start by confirming that the company has done a great job of growing revenues over that time.
Comparing that recent medium-term revenue trajectory with the industry's one-year growth forecast of 5.6% shows it's noticeably more attractive.
With this information, we find it odd that S.C. Comcereal is trading at a P/S lower than the industry. It looks like most investors are not convinced the company can maintain its recent growth rates.
What We Can Learn From S.C. Comcereal's P/S?
S.C. Comcereal's P/S looks about as weak as its stock price lately. We'd say the price-to-sales ratio's power isn't primarily as a valuation instrument but rather to gauge current investor sentiment and future expectations.
Our examination of S.C. Comcereal revealed its three-year revenue trends aren't boosting its P/S anywhere near as much as we would have predicted, given they look better than current industry expectations. Potential investors that are sceptical over continued revenue performance may be preventing the P/S ratio from matching previous strong performance. It appears many are indeed anticipating revenue instability, because the persistence of these recent medium-term conditions would normally provide a boost to the share price.
There are also other vital risk factors to consider and we've discovered 4 warning signs for S.C. Comcereal (2 are a bit unpleasant!) that you should be aware of before investing here.
If companies with solid past earnings growth is up your alley, you may wish to see this free collection of other companies with strong earnings growth and low P/E ratios.
New: Manage All Your Stock Portfolios in One Place
We've created the ultimate portfolio companion for stock investors, and it's free.
• Connect an unlimited number of Portfolios and see your total in one currency
• Be alerted to new Warning Signs or Risks via email or mobile
• Track the Fair Value of your stocks
Have feedback on this article? Concerned about the content? Get in touch with us directly. Alternatively, email editorial-team (at) simplywallst.com.
This article by Simply Wall St is general in nature. We provide commentary based on historical data and analyst forecasts only using an unbiased methodology and our articles are not intended to be financial advice. It does not constitute a recommendation to buy or sell any stock, and does not take account of your objectives, or your financial situation. We aim to bring you long-term focused analysis driven by fundamental data. Note that our analysis may not factor in the latest price-sensitive company announcements or qualitative material. Simply Wall St has no position in any stocks mentioned.
About BVB:CBOT
S.C. Comcereal
S.C. Comcereal S.A. contracts, purchases, and take-over cereals, pulses, grains, and oilseeds from agricultural producers for fund consumption and seeds in Romania.
Mediocre balance sheet with low risk.
Market Insights

Advertisement
Community Narratives
The company that turned a verb into a global necessity and basically runs the modern internet, digital ads, smartphones, maps, and AI.
Fair Value US$300.00|7.1% undervalued
OS
Community Contributor
Flowers Foods Pays A Fair Price For Health
Fair Value US$16.12|26.4% undervalued
NV
Community Contributor
TMX Group will thrive with 33.3% profit margin and enduring market moat
Fair Value CA$49.90|0.8% overvalued
LI
Community Contributor
The "Molecular Pencil": Why Beam's Technology is Built to Win
Fair Value US$65.01|65.8% undervalued
DA
Community Contributor