Stock Analysis
- Qatar
- /
- Healthcare Services
- /
- DSM:MCGS
Despite the downward trend in earnings at Medicare Group Q.P.S.C (DSM:MCGS) the stock rallies 14%, bringing five-year gains to 35%


The main point of investing for the long term is to make money. Furthermore, you'd generally like to see the share price rise faster than the market. Unfortunately for shareholders, while the Medicare Group Q.P.S.C. (DSM:MCGS) share price is up 16% in the last five years, that's less than the market return. Zooming in, the stock is up just 3.5% in the last year.
The past week has proven to be lucrative for Medicare Group Q.P.S.C investors, so let's see if fundamentals drove the company's five-year performance.
Check out our latest analysis for Medicare Group Q.P.S.C
SWOT Analysis for Medicare Group Q.P.S.C
- Earnings growth over the past year exceeded the industry.
- Debt is not viewed as a risk.
- Dividend is low compared to the top 25% of dividend payers in the Healthcare market.
- Current share price is above our estimate of fair value.
- MCGS' financial characteristics indicate limited near-term opportunities for shareholders.
- Lack of analyst coverage makes it difficult to determine MCGS' earnings prospects.
- Dividends are not covered by earnings and cashflows.
While markets are a powerful pricing mechanism, share prices reflect investor sentiment, not just underlying business performance. One flawed but reasonable way to assess how sentiment around a company has changed is to compare the earnings per share (EPS) with the share price.
During five years of share price growth, Medicare Group Q.P.S.C actually saw its EPS drop 0.4% per year.
With EPS falling, but a modestly increasing share price, it seems that the market was probably too pessimistic about the stock in the past. Having said that, if the EPS falls continue we'd be surprised to see a sustained increase in share price.
The company's earnings per share (over time) is depicted in the image below (click to see the exact numbers).
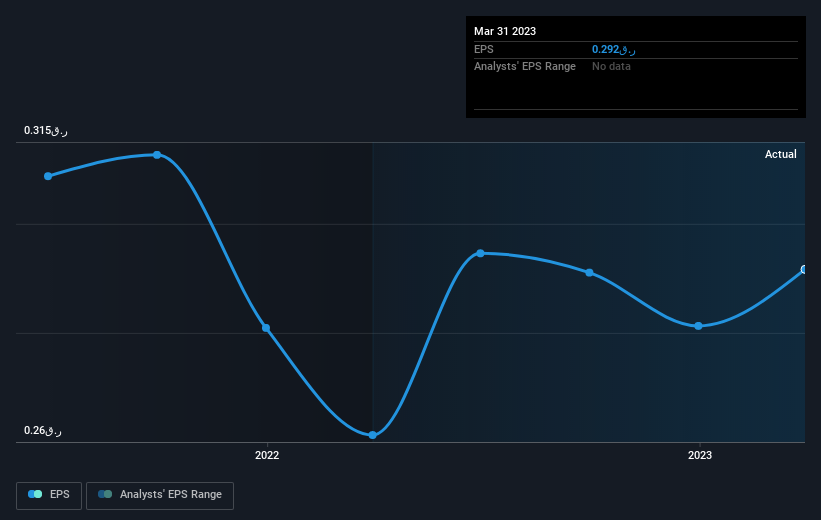
Dive deeper into Medicare Group Q.P.S.C's key metrics by checking this interactive graph of Medicare Group Q.P.S.C's earnings, revenue and cash flow.
What About Dividends?
As well as measuring the share price return, investors should also consider the total shareholder return (TSR). Whereas the share price return only reflects the change in the share price, the TSR includes the value of dividends (assuming they were reinvested) and the benefit of any discounted capital raising or spin-off. Arguably, the TSR gives a more comprehensive picture of the return generated by a stock. We note that for Medicare Group Q.P.S.C the TSR over the last 5 years was 35%, which is better than the share price return mentioned above. This is largely a result of its dividend payments!
A Different Perspective
It's good to see that Medicare Group Q.P.S.C has rewarded shareholders with a total shareholder return of 3.5% in the last twelve months. That's including the dividend. Having said that, the five-year TSR of 6% a year, is even better. Potential buyers might understandably feel they've missed the opportunity, but it's always possible business is still firing on all cylinders. I find it very interesting to look at share price over the long term as a proxy for business performance. But to truly gain insight, we need to consider other information, too. For example, we've discovered 2 warning signs for Medicare Group Q.P.S.C that you should be aware of before investing here.
Of course, you might find a fantastic investment by looking elsewhere. So take a peek at this free list of companies we expect will grow earnings.
Please note, the market returns quoted in this article reflect the market weighted average returns of stocks that currently trade on Qatari exchanges.
Valuation is complex, but we're helping make it simple.
Find out whether Medicare Group Q.P.S.C is potentially over or undervalued by checking out our comprehensive analysis, which includes fair value estimates, risks and warnings, dividends, insider transactions and financial health.
View the Free AnalysisHave feedback on this article? Concerned about the content? Get in touch with us directly. Alternatively, email editorial-team (at) simplywallst.com.
This article by Simply Wall St is general in nature. We provide commentary based on historical data and analyst forecasts only using an unbiased methodology and our articles are not intended to be financial advice. It does not constitute a recommendation to buy or sell any stock, and does not take account of your objectives, or your financial situation. We aim to bring you long-term focused analysis driven by fundamental data. Note that our analysis may not factor in the latest price-sensitive company announcements or qualitative material. Simply Wall St has no position in any stocks mentioned.
About DSM:MCGS
Medicare Group Q.P.S.C
Medicare Group Q.P.S.C. provides healthcare and treatment services in Qatar.
Excellent balance sheet and overvalued.
