Stock Analysis
The five-year decline in earnings might be taking its toll on Zad Holding Company Q.P.S.C (DSM:ZHCD) shareholders as stock falls 6.7% over the past week


Stock pickers are generally looking for stocks that will outperform the broader market. And the truth is, you can make significant gains if you buy good quality businesses at the right price. To wit, the Zad Holding Company Q.P.S.C share price has climbed 58% in five years, easily topping the market decline of 11% (ignoring dividends).
Since the long term performance has been good but there's been a recent pullback of 6.7%, let's check if the fundamentals match the share price.
See our latest analysis for Zad Holding Company Q.P.S.C
To paraphrase Benjamin Graham: Over the short term the market is a voting machine, but over the long term it's a weighing machine. One flawed but reasonable way to assess how sentiment around a company has changed is to compare the earnings per share (EPS) with the share price.
During five years of share price growth, Zad Holding Company Q.P.S.C actually saw its EPS drop 1.1% per year.
So it's hard to argue that the earnings per share are the best metric to judge the company, as it may not be optimized for profits at this point. Since the change in EPS doesn't seem to correlate with the change in share price, it's worth taking a look at other metrics.
In fact, the dividend has increased over time, which is a positive. Maybe dividend investors have helped support the share price.
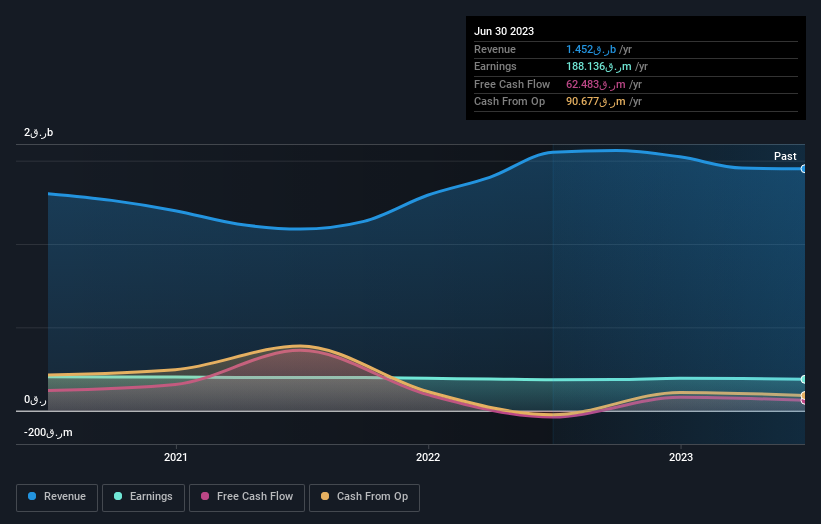
The image below shows how earnings and revenue have tracked over time (if you click on the image you can see greater detail).
You can see how its balance sheet has strengthened (or weakened) over time in this free interactive graphic.
What About Dividends?
When looking at investment returns, it is important to consider the difference between total shareholder return (TSR) and share price return. The TSR is a return calculation that accounts for the value of cash dividends (assuming that any dividend received was reinvested) and the calculated value of any discounted capital raisings and spin-offs. Arguably, the TSR gives a more comprehensive picture of the return generated by a stock. As it happens, Zad Holding Company Q.P.S.C's TSR for the last 5 years was 99%, which exceeds the share price return mentioned earlier. And there's no prize for guessing that the dividend payments largely explain the divergence!
A Different Perspective
Zad Holding Company Q.P.S.C shareholders are down 19% over twelve months (even including dividends), which isn't far from the market return of -19%. The silver lining is that longer term investors would have made a total return of 15% per year over half a decade. If the stock price has been impacted by changing sentiment, rather than deteriorating business conditions, it could spell opportunity. It's always interesting to track share price performance over the longer term. But to understand Zad Holding Company Q.P.S.C better, we need to consider many other factors. For example, we've discovered 2 warning signs for Zad Holding Company Q.P.S.C that you should be aware of before investing here.
Of course, you might find a fantastic investment by looking elsewhere. So take a peek at this free list of companies we expect will grow earnings.
Please note, the market returns quoted in this article reflect the market weighted average returns of stocks that currently trade on Qatari exchanges.
Valuation is complex, but we're helping make it simple.
Find out whether Zad Holding Company Q.P.S.C is potentially over or undervalued by checking out our comprehensive analysis, which includes fair value estimates, risks and warnings, dividends, insider transactions and financial health.
View the Free AnalysisHave feedback on this article? Concerned about the content? Get in touch with us directly. Alternatively, email editorial-team (at) simplywallst.com.
This article by Simply Wall St is general in nature. We provide commentary based on historical data and analyst forecasts only using an unbiased methodology and our articles are not intended to be financial advice. It does not constitute a recommendation to buy or sell any stock, and does not take account of your objectives, or your financial situation. We aim to bring you long-term focused analysis driven by fundamental data. Note that our analysis may not factor in the latest price-sensitive company announcements or qualitative material. Simply Wall St has no position in any stocks mentioned.
About DSM:ZHCD
Zad Holding Company Q.P.S.C
Zad Holding Company Q.P.S.C. engages in the manufacture and distribution of fast-moving-consumer-goods in Qatar and internationally.
Excellent balance sheet with questionable track record.
