Stock Analysis
- Qatar
- /
- Capital Markets
- /
- DSM:IHGS
INMA Holding Company Q.P.S.C's (DSM:IHGS) 49% CAGR outpaced the company's earnings growth over the same three-year period


The most you can lose on any stock (assuming you don't use leverage) is 100% of your money. But in contrast you can make much more than 100% if the company does well. To wit, the INMA Holding Company Q.P.S.C. (DSM:IHGS) share price has flown 218% in the last three years. How nice for those who held the stock! On top of that, the share price is up 90% in about a quarter.
Since it's been a strong week for INMA Holding Company Q.P.S.C shareholders, let's have a look at trend of the longer term fundamentals.
See our latest analysis for INMA Holding Company Q.P.S.C
While markets are a powerful pricing mechanism, share prices reflect investor sentiment, not just underlying business performance. One way to examine how market sentiment has changed over time is to look at the interaction between a company's share price and its earnings per share (EPS).
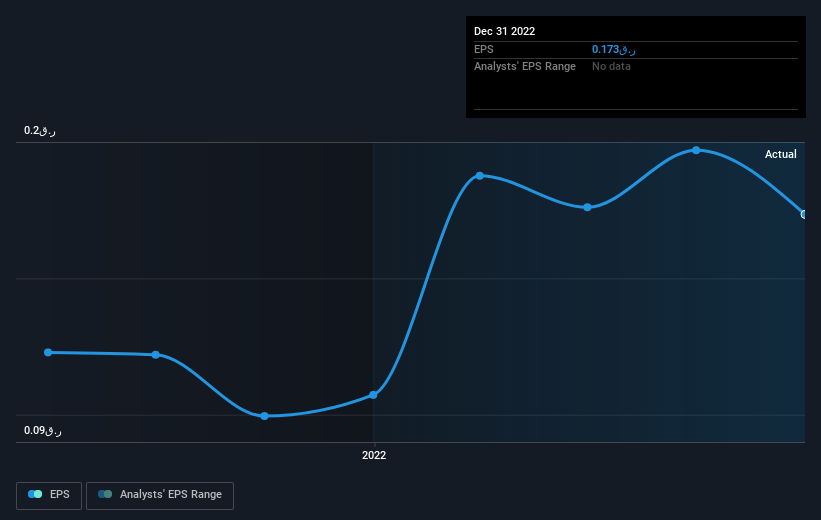
INMA Holding Company Q.P.S.C was able to grow its EPS at 191% per year over three years, sending the share price higher. The average annual share price increase of 47% is actually lower than the EPS growth. Therefore, it seems the market has moderated its expectations for growth, somewhat.
The graphic below depicts how EPS has changed over time (unveil the exact values by clicking on the image).
It might be well worthwhile taking a look at our free report on INMA Holding Company Q.P.S.C's earnings, revenue and cash flow.
What About Dividends?
When looking at investment returns, it is important to consider the difference between total shareholder return (TSR) and share price return. Whereas the share price return only reflects the change in the share price, the TSR includes the value of dividends (assuming they were reinvested) and the benefit of any discounted capital raising or spin-off. It's fair to say that the TSR gives a more complete picture for stocks that pay a dividend. In the case of INMA Holding Company Q.P.S.C, it has a TSR of 230% for the last 3 years. That exceeds its share price return that we previously mentioned. And there's no prize for guessing that the dividend payments largely explain the divergence!
A Different Perspective
While it's never nice to take a loss, INMA Holding Company Q.P.S.C shareholders can take comfort that , including dividends,their trailing twelve month loss of 2.5% wasn't as bad as the market loss of around 13%. Longer term investors wouldn't be so upset, since they would have made 15%, each year, over five years. In the best case scenario the last year is just a temporary blip on the journey to a brighter future. While it is well worth considering the different impacts that market conditions can have on the share price, there are other factors that are even more important. Like risks, for instance. Every company has them, and we've spotted 2 warning signs for INMA Holding Company Q.P.S.C (of which 1 shouldn't be ignored!) you should know about.
For those who like to find winning investments this free list of growing companies with recent insider purchasing, could be just the ticket.
Please note, the market returns quoted in this article reflect the market weighted average returns of stocks that currently trade on Qatari exchanges.
Valuation is complex, but we're helping make it simple.
Find out whether INMA Holding Company Q.P.S.C is potentially over or undervalued by checking out our comprehensive analysis, which includes fair value estimates, risks and warnings, dividends, insider transactions and financial health.
View the Free AnalysisHave feedback on this article? Concerned about the content? Get in touch with us directly. Alternatively, email editorial-team (at) simplywallst.com.
This article by Simply Wall St is general in nature. We provide commentary based on historical data and analyst forecasts only using an unbiased methodology and our articles are not intended to be financial advice. It does not constitute a recommendation to buy or sell any stock, and does not take account of your objectives, or your financial situation. We aim to bring you long-term focused analysis driven by fundamental data. Note that our analysis may not factor in the latest price-sensitive company announcements or qualitative material. Simply Wall St has no position in any stocks mentioned.
About DSM:IHGS
INMA Holding Company Q.P.S.C
INMA Holding Company Q.P.S.C., together with its subsidiaries, invests in shares and bonds in Qatar.
Solid track record with adequate balance sheet.
