Declining Stock and Solid Fundamentals: Is The Market Wrong About S4E S.A. (WSE:S4E)?


S4E (WSE:S4E) has had a rough week with its share price down 16%. But if you pay close attention, you might gather that its strong financials could mean that the stock could potentially see an increase in value in the long-term, given how markets usually reward companies with good financial health. Particularly, we will be paying attention to S4E's ROE today.
Return on equity or ROE is an important factor to be considered by a shareholder because it tells them how effectively their capital is being reinvested. In short, ROE shows the profit each dollar generates with respect to its shareholder investments.
Check out our latest analysis for S4E
How To Calculate Return On Equity?
The formula for return on equity is:
Return on Equity = Net Profit (from continuing operations) ÷ Shareholders' Equity
So, based on the above formula, the ROE for S4E is:
24% = zł5.9m ÷ zł24m (Based on the trailing twelve months to June 2024).
The 'return' is the yearly profit. One way to conceptualize this is that for each PLN1 of shareholders' capital it has, the company made PLN0.24 in profit.
Why Is ROE Important For Earnings Growth?
Thus far, we have learned that ROE measures how efficiently a company is generating its profits. Depending on how much of these profits the company reinvests or "retains", and how effectively it does so, we are then able to assess a company’s earnings growth potential. Assuming all else is equal, companies that have both a higher return on equity and higher profit retention are usually the ones that have a higher growth rate when compared to companies that don't have the same features.
A Side By Side comparison of S4E's Earnings Growth And 24% ROE
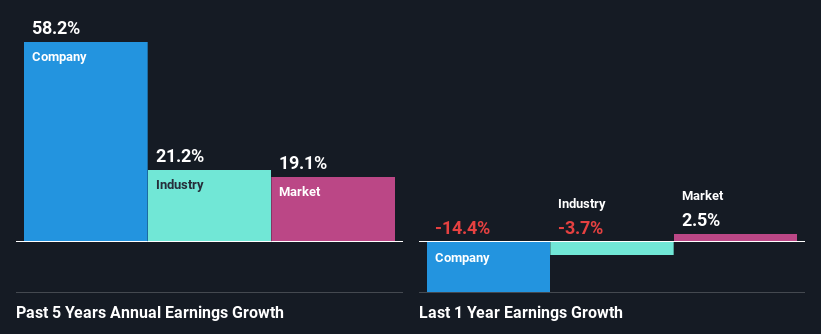
To begin with, S4E has a pretty high ROE which is interesting. Second, a comparison with the average ROE reported by the industry of 13% also doesn't go unnoticed by us. So, the substantial 58% net income growth seen by S4E over the past five years isn't overly surprising.
Next, on comparing with the industry net income growth, we found that S4E's growth is quite high when compared to the industry average growth of 21% in the same period, which is great to see.
The basis for attaching value to a company is, to a great extent, tied to its earnings growth. It’s important for an investor to know whether the market has priced in the company's expected earnings growth (or decline). Doing so will help them establish if the stock's future looks promising or ominous. One good indicator of expected earnings growth is the P/E ratio which determines the price the market is willing to pay for a stock based on its earnings prospects. So, you may want to check if S4E is trading on a high P/E or a low P/E, relative to its industry.
Is S4E Making Efficient Use Of Its Profits?
S4E doesn't pay any regular dividends to its shareholders, meaning that the company has been reinvesting all of its profits into the business. This is likely what's driving the high earnings growth number discussed above.
Summary
On the whole, we feel that S4E's performance has been quite good. Specifically, we like that the company is reinvesting a huge chunk of its profits at a high rate of return. This of course has caused the company to see substantial growth in its earnings. If the company continues to grow its earnings the way it has, that could have a positive impact on its share price given how earnings per share influence long-term share prices. Let's not forget, business risk is also one of the factors that affects the price of the stock. So this is also an important area that investors need to pay attention to before making a decision on any business. You can see the 2 risks we have identified for S4E by visiting our risks dashboard for free on our platform here.
New: Manage All Your Stock Portfolios in One Place
We've created the ultimate portfolio companion for stock investors, and it's free.
• Connect an unlimited number of Portfolios and see your total in one currency
• Be alerted to new Warning Signs or Risks via email or mobile
• Track the Fair Value of your stocks
Have feedback on this article? Concerned about the content? Get in touch with us directly. Alternatively, email editorial-team (at) simplywallst.com.
This article by Simply Wall St is general in nature. We provide commentary based on historical data and analyst forecasts only using an unbiased methodology and our articles are not intended to be financial advice. It does not constitute a recommendation to buy or sell any stock, and does not take account of your objectives, or your financial situation. We aim to bring you long-term focused analysis driven by fundamental data. Note that our analysis may not factor in the latest price-sensitive company announcements or qualitative material. Simply Wall St has no position in any stocks mentioned.
About WSE:S4E
S4E
Engages in the provision of hardware and software, data processing, and hardware consulting services in Poland.
Flawless balance sheet and good value.
