
Advertisement
- Poland
- /
- Paper and Forestry Products
- /
- WSE:STD
Does Standrew S.A.’s (WSE:STD) ROCE Reflect Well On The Business?
Today we are going to look at Standrew S.A. (WSE:STD) to see whether it might be an attractive investment prospect. Specifically, we'll consider its Return On Capital Employed (ROCE), since that will give us an insight into how efficiently the business can generate profits from the capital it requires.
First, we'll go over how we calculate ROCE. Then we'll compare its ROCE to similar companies. Then we'll determine how its current liabilities are affecting its ROCE.
Return On Capital Employed (ROCE): What is it?
ROCE is a metric for evaluating how much pre-tax income (in percentage terms) a company earns on the capital invested in its business. In general, businesses with a higher ROCE are usually better quality. In brief, it is a useful tool, but it is not without drawbacks. Renowned investment researcher Michael Mauboussin has suggested that a high ROCE can indicate that 'one dollar invested in the company generates value of more than one dollar'.
So, How Do We Calculate ROCE?
The formula for calculating the return on capital employed is:
Return on Capital Employed = Earnings Before Interest and Tax (EBIT) ÷ (Total Assets - Current Liabilities)
Or for Standrew:
0.075 = zł783k ÷ (zł20m - zł9.1m) (Based on the trailing twelve months to December 2019.)
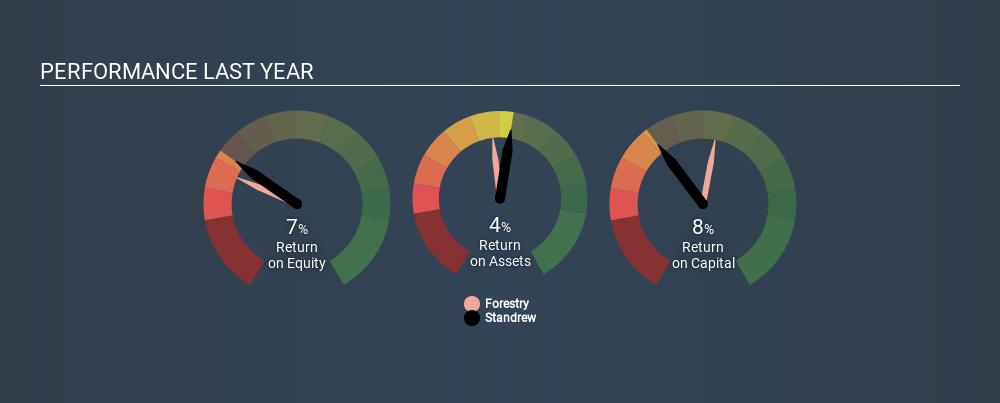
Therefore, Standrew has an ROCE of 7.5%.
View our latest analysis for Standrew
Is Standrew's ROCE Good?
One way to assess ROCE is to compare similar companies. It appears that Standrew's ROCE is fairly close to the Forestry industry average of 7.0%. Aside from the industry comparison, Standrew's ROCE is mediocre in absolute terms, considering the risk of investing in stocks versus the safety of a bank account. Investors may wish to consider higher-performing investments.
Standrew's current ROCE of 7.5% is lower than 3 years ago, when the company reported a 13% ROCE. This makes us wonder if the business is facing new challenges. You can see in the image below how Standrew's ROCE compares to its industry. Click to see more on past growth.
When considering this metric, keep in mind that it is backwards looking, and not necessarily predictive. Companies in cyclical industries can be difficult to understand using ROCE, as returns typically look high during boom times, and low during busts. ROCE is only a point-in-time measure. If Standrew is cyclical, it could make sense to check out this free graph of past earnings, revenue and cash flow.
Do Standrew's Current Liabilities Skew Its ROCE?
Liabilities, such as supplier bills and bank overdrafts, are referred to as current liabilities if they need to be paid within 12 months. Due to the way the ROCE equation works, having large bills due in the near term can make it look as though a company has less capital employed, and thus a higher ROCE than usual. To counter this, investors can check if a company has high current liabilities relative to total assets.
Standrew has current liabilities of zł9.1m and total assets of zł20m. Therefore its current liabilities are equivalent to approximately 47% of its total assets. Standrew has a medium level of current liabilities, which would boost its ROCE somewhat.
The Bottom Line On Standrew's ROCE
Unfortunately, its ROCE is still uninspiring, and there are potentially more attractive prospects out there. You might be able to find a better investment than Standrew. If you want a selection of possible winners, check out this free list of interesting companies that trade on a P/E below 20 (but have proven they can grow earnings).
If you are like me, then you will not want to miss this free list of growing companies that insiders are buying.
If you spot an error that warrants correction, please contact the editor at editorial-team@simplywallst.com. This article by Simply Wall St is general in nature. It does not constitute a recommendation to buy or sell any stock, and does not take account of your objectives, or your financial situation. Simply Wall St has no position in the stocks mentioned.
We aim to bring you long-term focused research analysis driven by fundamental data. Note that our analysis may not factor in the latest price-sensitive company announcements or qualitative material. Thank you for reading.
About WSE:STD
Standrew
Produces and sells oak lamellas and sawmill products primarily in Europe.
Moderate risk with imperfect balance sheet.
Market Insights

Advertisement
Community Narratives
The company that turned a verb into a global necessity and basically runs the modern internet, digital ads, smartphones, maps, and AI.
Fair Value US$300.00|7.1% undervalued
OS
Community Contributor
Flowers Foods Pays A Fair Price For Health
Fair Value US$16.12|26.4% undervalued
NV
Community Contributor
TMX Group will thrive with 33.3% profit margin and enduring market moat
Fair Value CA$49.90|0.8% overvalued
LI
Community Contributor
The "Molecular Pencil": Why Beam's Technology is Built to Win
Fair Value US$65.01|65.8% undervalued
DA
Community Contributor