
Advertisement
- Poland
- /
- Trade Distributors
- /
- WSE:STF
Can You Imagine How Jubilant Stalprofil's (WSE:STF) Shareholders Feel About Its 140% Share Price Gain?
Unless you borrow money to invest, the potential losses are limited. But if you pick the right business to buy shares in, you can make more than you can lose. Take, for example Stalprofil S.A. (WSE:STF). Its share price is already up an impressive 140% in the last twelve months. Also pleasing for shareholders was the 31% gain in the last three months. In contrast, the longer term returns are negative, since the share price is 24% lower than it was three years ago.
See our latest analysis for Stalprofil
There is no denying that markets are sometimes efficient, but prices do not always reflect underlying business performance. One imperfect but simple way to consider how the market perception of a company has shifted is to compare the change in the earnings per share (EPS) with the share price movement.
Over the last twelve months, Stalprofil actually shrank its EPS by 0.4%.
The mild decline in EPS may be a result of the fact that the company is more focused on other aspects of the business, right now. It makes sense to check some of the other fundamental data for an explanation of the share price rise.
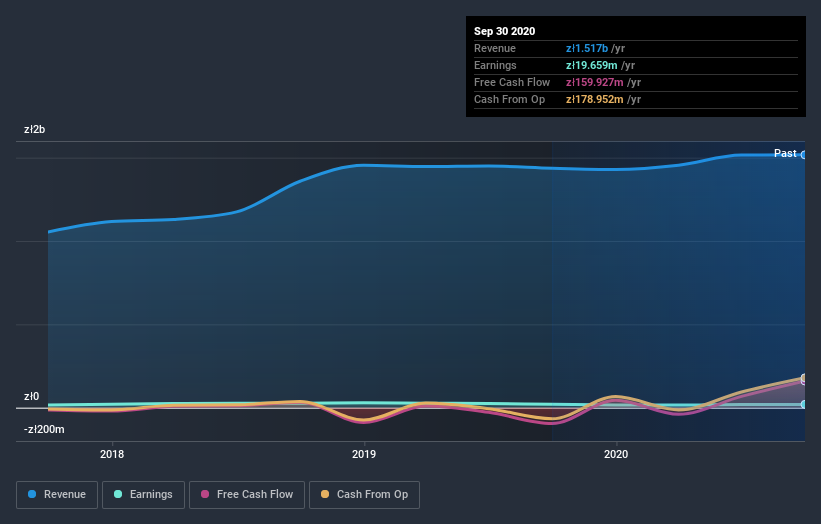
We are skeptical of the suggestion that the 1.0% dividend yield would entice buyers to the stock. We think that the revenue growth of 5.6% could have some investors interested. Many businesses do go through a phase where they have to forgo some profits to drive business development, and sometimes its for the best.
The graphic below depicts how earnings and revenue have changed over time (unveil the exact values by clicking on the image).
You can see how its balance sheet has strengthened (or weakened) over time in this free interactive graphic.
What About Dividends?
As well as measuring the share price return, investors should also consider the total shareholder return (TSR). Whereas the share price return only reflects the change in the share price, the TSR includes the value of dividends (assuming they were reinvested) and the benefit of any discounted capital raising or spin-off. It's fair to say that the TSR gives a more complete picture for stocks that pay a dividend. In the case of Stalprofil, it has a TSR of 143% for the last year. That exceeds its share price return that we previously mentioned. This is largely a result of its dividend payments!
A Different Perspective
It's nice to see that Stalprofil shareholders have received a total shareholder return of 143% over the last year. That's including the dividend. That gain is better than the annual TSR over five years, which is 5%. Therefore it seems like sentiment around the company has been positive lately. Someone with an optimistic perspective could view the recent improvement in TSR as indicating that the business itself is getting better with time. It's always interesting to track share price performance over the longer term. But to understand Stalprofil better, we need to consider many other factors. Case in point: We've spotted 2 warning signs for Stalprofil you should be aware of.
We will like Stalprofil better if we see some big insider buys. While we wait, check out this free list of growing companies with considerable, recent, insider buying.
Please note, the market returns quoted in this article reflect the market weighted average returns of stocks that currently trade on PL exchanges.
When trading Stalprofil or any other investment, use the platform considered by many to be the Professional's Gateway to the Worlds Market, Interactive Brokers. You get the lowest-cost* trading on stocks, options, futures, forex, bonds and funds worldwide from a single integrated account. Promoted
New: Manage All Your Stock Portfolios in One Place
We've created the ultimate portfolio companion for stock investors, and it's free.
• Connect an unlimited number of Portfolios and see your total in one currency
• Be alerted to new Warning Signs or Risks via email or mobile
• Track the Fair Value of your stocks
This article by Simply Wall St is general in nature. It does not constitute a recommendation to buy or sell any stock, and does not take account of your objectives, or your financial situation. We aim to bring you long-term focused analysis driven by fundamental data. Note that our analysis may not factor in the latest price-sensitive company announcements or qualitative material. Simply Wall St has no position in any stocks mentioned.
*Interactive Brokers Rated Lowest Cost Broker by StockBrokers.com Annual Online Review 2020
Have feedback on this article? Concerned about the content? Get in touch with us directly. Alternatively, email editorial-team (at) simplywallst.com.
About WSE:STF
Slight risk with mediocre balance sheet.
Market Insights

Advertisement
Community Narratives
The "Molecular Pencil": Why Beam's Technology is Built to Win
Fair Value US$65.01|66.7% undervalued
DA
Community Contributor
The silent giant behind virtually every advanced chip powering AI, smartphones, and modern infrastructure.
Fair Value US$310.00|4.8% undervalued
OS
Community Contributor
ADP Stock: Solid Fundamentals, But AI Investments Test Its Margin Resilience
Fair Value US$387.77|34.5% undervalued
YI
Community Contributor
MINISO's fair value is projected at 26.69 with an anticipated PE ratio shift of 20x
Fair Value US$26.69|18.6% undervalued
BE
Community Contributor