Stock Analysis
Are StrongPoint ASA’s (OB:STRONG) Returns Worth Your While?


Today we'll look at StrongPoint ASA (OB:STRONG) and reflect on its potential as an investment. Specifically, we're going to calculate its Return On Capital Employed (ROCE), in the hopes of getting some insight into the business.
First of all, we'll work out how to calculate ROCE. Then we'll compare its ROCE to similar companies. Finally, we'll look at how its current liabilities affect its ROCE.
Return On Capital Employed (ROCE): What is it?
ROCE is a measure of a company's yearly pre-tax profit (its return), relative to the capital employed in the business. Generally speaking a higher ROCE is better. In brief, it is a useful tool, but it is not without drawbacks. Author Edwin Whiting says to be careful when comparing the ROCE of different businesses, since 'No two businesses are exactly alike.
How Do You Calculate Return On Capital Employed?
Analysts use this formula to calculate return on capital employed:
Return on Capital Employed = Earnings Before Interest and Tax (EBIT) ÷ (Total Assets - Current Liabilities)
Or for StrongPoint:
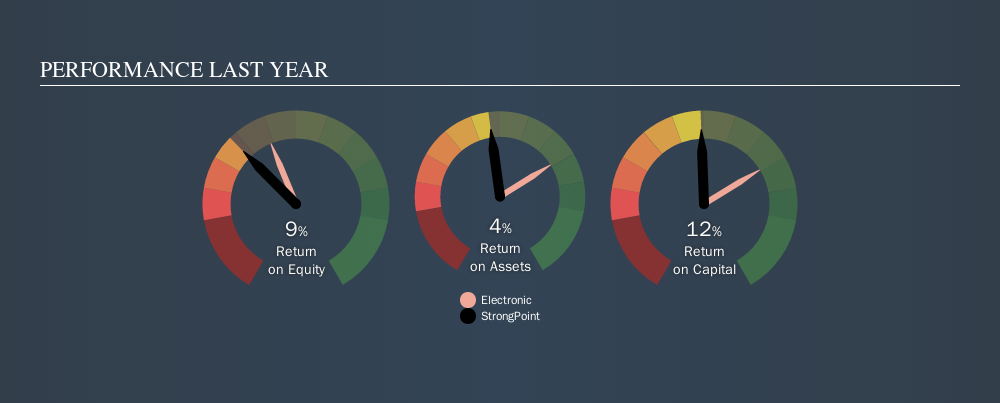
0.12 = kr41m ÷ (kr681m - kr330m) (Based on the trailing twelve months to June 2019.)
So, StrongPoint has an ROCE of 12%.
See our latest analysis for StrongPoint
Is StrongPoint's ROCE Good?
One way to assess ROCE is to compare similar companies. We can see StrongPoint's ROCE is around the 12% average reported by the Electronic industry. Separate from StrongPoint's performance relative to its industry, its ROCE in absolute terms looks satisfactory, and it may be worth researching in more depth.
StrongPoint's current ROCE of 12% is lower than its ROCE in the past, which was 19%, 3 years ago. This makes us wonder if the business is facing new challenges. You can click on the image below to see (in greater detail) how StrongPoint's past growth compares to other companies.
When considering this metric, keep in mind that it is backwards looking, and not necessarily predictive. Companies in cyclical industries can be difficult to understand using ROCE, as returns typically look high during boom times, and low during busts. This is because ROCE only looks at one year, instead of considering returns across a whole cycle. Since the future is so important for investors, you should check out our free report on analyst forecasts for StrongPoint.
What Are Current Liabilities, And How Do They Affect StrongPoint's ROCE?
Liabilities, such as supplier bills and bank overdrafts, are referred to as current liabilities if they need to be paid within 12 months. Due to the way the ROCE equation works, having large bills due in the near term can make it look as though a company has less capital employed, and thus a higher ROCE than usual. To counteract this, we check if a company has high current liabilities, relative to its total assets.
StrongPoint has total assets of kr681m and current liabilities of kr330m. Therefore its current liabilities are equivalent to approximately 49% of its total assets. With this level of current liabilities, StrongPoint's ROCE is boosted somewhat.
The Bottom Line On StrongPoint's ROCE
StrongPoint's ROCE does look good, but the level of current liabilities also contribute to that. There might be better investments than StrongPoint out there, but you will have to work hard to find them . These promising businesses with rapidly growing earnings might be right up your alley.
StrongPoint is not the only stock insiders are buying. So take a peek at this free list of growing companies with insider buying.
We aim to bring you long-term focused research analysis driven by fundamental data. Note that our analysis may not factor in the latest price-sensitive company announcements or qualitative material.
If you spot an error that warrants correction, please contact the editor at editorial-team@simplywallst.com. This article by Simply Wall St is general in nature. It does not constitute a recommendation to buy or sell any stock, and does not take account of your objectives, or your financial situation. Simply Wall St has no position in the stocks mentioned. Thank you for reading.
About OB:STRO
StrongPoint
Develops, sells, and implements integrated technology solutions for in-store and online shopping in Scandinavia and internationally.
Good value with reasonable growth potential.
