Stock Analysis

Most readers would already be aware that Vistin Pharma's (OB:VISTN) stock increased significantly by 28% over the past three months. However, we decided to pay attention to the company's fundamentals which don't appear to give a clear sign about the company's financial health. Specifically, we decided to study Vistin Pharma's ROE in this article.
Return on equity or ROE is an important factor to be considered by a shareholder because it tells them how effectively their capital is being reinvested. Simply put, it is used to assess the profitability of a company in relation to its equity capital.
View our latest analysis for Vistin Pharma
How Is ROE Calculated?
The formula for return on equity is:
Return on Equity = Net Profit (from continuing operations) ÷ Shareholders' Equity
So, based on the above formula, the ROE for Vistin Pharma is:
2.8% = kr7.5m ÷ kr270m (Based on the trailing twelve months to March 2023).
The 'return' is the income the business earned over the last year. One way to conceptualize this is that for each NOK1 of shareholders' capital it has, the company made NOK0.03 in profit.
What Is The Relationship Between ROE And Earnings Growth?
We have already established that ROE serves as an efficient profit-generating gauge for a company's future earnings. Depending on how much of these profits the company reinvests or "retains", and how effectively it does so, we are then able to assess a company’s earnings growth potential. Assuming everything else remains unchanged, the higher the ROE and profit retention, the higher the growth rate of a company compared to companies that don't necessarily bear these characteristics.
Vistin Pharma's Earnings Growth And 2.8% ROE
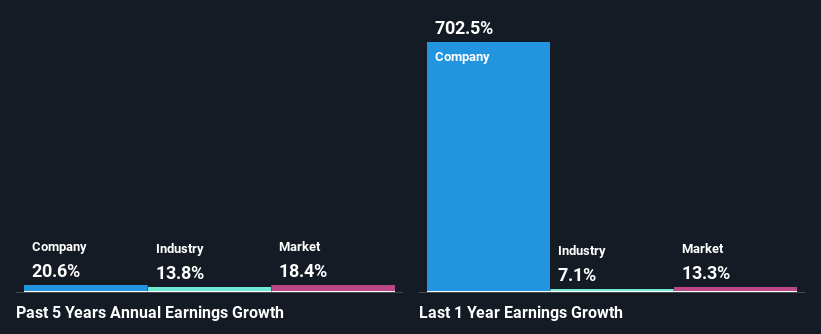
As you can see, Vistin Pharma's ROE looks pretty weak. Even when compared to the industry average of 10%, the ROE figure is pretty disappointing. However, we we're pleasantly surprised to see that Vistin Pharma grew its net income at a significant rate of 21% in the last five years. We believe that there might be other aspects that are positively influencing the company's earnings growth. For example, it is possible that the company's management has made some good strategic decisions, or that the company has a low payout ratio.
Next, on comparing with the industry net income growth, we found that Vistin Pharma's growth is quite high when compared to the industry average growth of 12% in the same period, which is great to see.
Earnings growth is a huge factor in stock valuation. The investor should try to establish if the expected growth or decline in earnings, whichever the case may be, is priced in. By doing so, they will have an idea if the stock is headed into clear blue waters or if swampy waters await. Is Vistin Pharma fairly valued compared to other companies? These 3 valuation measures might help you decide.
Is Vistin Pharma Using Its Retained Earnings Effectively?
The really high LTM (or last twelve month) payout ratio of 446% for Vistin Pharma suggests that the company is paying its shareholders more than what it is earning. Despite this, the company's earnings grew significantly as we saw above. Although, it could be worth keeping an eye on the high payout ratio as that's a huge risk.
Besides, Vistin Pharma has been paying dividends over a period of seven years. This shows that the company is committed to sharing profits with its shareholders.
Conclusion
In total, we're a bit ambivalent about Vistin Pharma's performance. While the company has posted impressive earnings growth, its poor ROE and low earnings retention makes us doubtful if that growth could continue, if by any chance the business is faced with any sort of risk. Until now, we have only just grazed the surface of the company's past performance by looking at the company's fundamentals. You can do your own research on Vistin Pharma and see how it has performed in the past by looking at this FREE detailed graph of past earnings, revenue and cash flows.
Valuation is complex, but we're helping make it simple.
Find out whether Vistin Pharma is potentially over or undervalued by checking out our comprehensive analysis, which includes fair value estimates, risks and warnings, dividends, insider transactions and financial health.
View the Free AnalysisHave feedback on this article? Concerned about the content? Get in touch with us directly. Alternatively, email editorial-team (at) simplywallst.com.
This article by Simply Wall St is general in nature. We provide commentary based on historical data and analyst forecasts only using an unbiased methodology and our articles are not intended to be financial advice. It does not constitute a recommendation to buy or sell any stock, and does not take account of your objectives, or your financial situation. We aim to bring you long-term focused analysis driven by fundamental data. Note that our analysis may not factor in the latest price-sensitive company announcements or qualitative material. Simply Wall St has no position in any stocks mentioned.
About OB:VISTN
Vistin Pharma
Vistin Pharma ASA, through its subsidiary, Vistin Pharma AS, produces and sells active pharmaceutical ingredients (APIs) worldwide.
Solid track record with excellent balance sheet.

