- Norway
- /
- Construction
- /
- OB:AFG
AF Gruppen's (OB:AFG) earnings have declined over three years, contributing to shareholders 8.6% loss


Many investors define successful investing as beating the market average over the long term. But the risk of stock picking is that you will likely buy under-performing companies. Unfortunately, that's been the case for longer term AF Gruppen ASA (OB:AFG) shareholders, since the share price is down 24% in the last three years, falling well short of the market return of around 58%. Shareholders have had an even rougher run lately, with the share price down 12% in the last 90 days.
On a more encouraging note the company has added kr731m to its market cap in just the last 7 days, so let's see if we can determine what's driven the three-year loss for shareholders.
Check out our latest analysis for AF Gruppen
While markets are a powerful pricing mechanism, share prices reflect investor sentiment, not just underlying business performance. One way to examine how market sentiment has changed over time is to look at the interaction between a company's share price and its earnings per share (EPS).
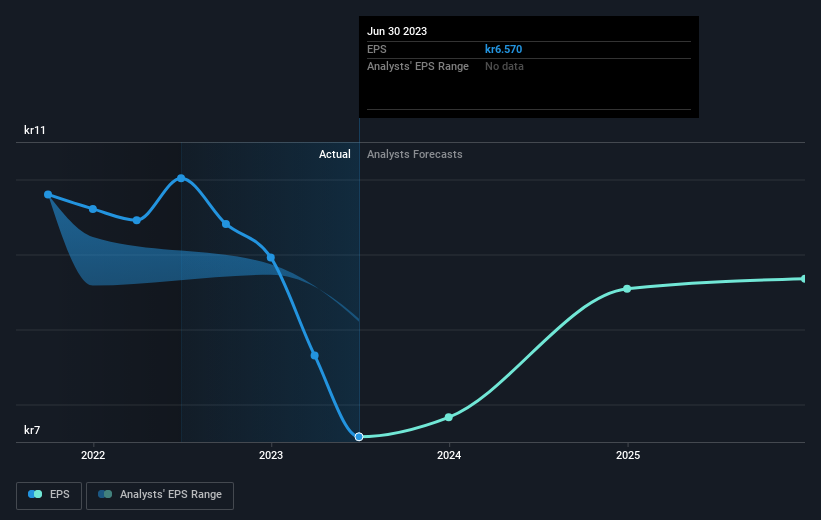
During the three years that the share price fell, AF Gruppen's earnings per share (EPS) dropped by 3.6% each year. This reduction in EPS is slower than the 9% annual reduction in the share price. So it's likely that the EPS decline has disappointed the market, leaving investors hesitant to buy.
You can see below how EPS has changed over time (discover the exact values by clicking on the image).
Dive deeper into AF Gruppen's key metrics by checking this interactive graph of AF Gruppen's earnings, revenue and cash flow.
What About Dividends?
When looking at investment returns, it is important to consider the difference between total shareholder return (TSR) and share price return. Whereas the share price return only reflects the change in the share price, the TSR includes the value of dividends (assuming they were reinvested) and the benefit of any discounted capital raising or spin-off. Arguably, the TSR gives a more comprehensive picture of the return generated by a stock. In the case of AF Gruppen, it has a TSR of -8.6% for the last 3 years. That exceeds its share price return that we previously mentioned. And there's no prize for guessing that the dividend payments largely explain the divergence!
A Different Perspective
Investors in AF Gruppen had a tough year, with a total loss of 15% (including dividends), against a market gain of about 9.0%. However, keep in mind that even the best stocks will sometimes underperform the market over a twelve month period. Longer term investors wouldn't be so upset, since they would have made 5%, each year, over five years. If the fundamental data continues to indicate long term sustainable growth, the current sell-off could be an opportunity worth considering. I find it very interesting to look at share price over the long term as a proxy for business performance. But to truly gain insight, we need to consider other information, too. Take risks, for example - AF Gruppen has 2 warning signs (and 1 which is significant) we think you should know about.
We will like AF Gruppen better if we see some big insider buys. While we wait, check out this free list of growing companies with considerable, recent, insider buying.
Please note, the market returns quoted in this article reflect the market weighted average returns of stocks that currently trade on Norwegian exchanges.
New: Manage All Your Stock Portfolios in One Place
We've created the ultimate portfolio companion for stock investors, and it's free.
• Connect an unlimited number of Portfolios and see your total in one currency
• Be alerted to new Warning Signs or Risks via email or mobile
• Track the Fair Value of your stocks
Have feedback on this article? Concerned about the content? Get in touch with us directly. Alternatively, email editorial-team (at) simplywallst.com.
This article by Simply Wall St is general in nature. We provide commentary based on historical data and analyst forecasts only using an unbiased methodology and our articles are not intended to be financial advice. It does not constitute a recommendation to buy or sell any stock, and does not take account of your objectives, or your financial situation. We aim to bring you long-term focused analysis driven by fundamental data. Note that our analysis may not factor in the latest price-sensitive company announcements or qualitative material. Simply Wall St has no position in any stocks mentioned.
About OB:AFG
AF Gruppen
A contracting and industrial company, provides civil engineering, environmental, construction, property, energy, and offshore services in Norway and Sweden.
High growth potential with excellent balance sheet.

