Advertisement
- Germany
- /
- Specialty Stores
- /
- XTRA:WEW
European Market Value Stocks To Consider For Your Portfolio

Simply Wall St
Reviewed by Simply Wall St
In recent weeks, the European stock market has experienced a pullback, with major indices like Germany's DAX and France's CAC 40 showing declines amid concerns about overvaluation in artificial intelligence-related stocks. As investors navigate these conditions, identifying undervalued stocks can be an effective strategy to potentially capitalize on future growth when the market stabilizes.
Top 10 Undervalued Stocks Based On Cash Flows In Europe
| Name | Current Price | Fair Value (Est) | Discount (Est) |
| Rusta (OM:RUSTA) | SEK64.45 | SEK126.74 | 49.1% |
| Roche Bobois (ENXTPA:RBO) | €35.60 | €69.78 | 49% |
| Recupero Etico Sostenibile (BIT:RES) | €6.50 | €12.89 | 49.6% |
| Nokian Panimo Oyj (HLSE:BEER) | €2.48 | €4.88 | 49.1% |
| E-Globe (BIT:EGB) | €0.67 | €1.31 | 48.9% |
| Doxee (BIT:DOX) | €3.72 | €7.40 | 49.7% |
| doValue (BIT:DOV) | €2.608 | €5.20 | 49.8% |
| B&S Group (ENXTAM:BSGR) | €5.94 | €11.85 | 49.9% |
| Bonesupport Holding (OM:BONEX) | SEK198.80 | SEK391.01 | 49.2% |
| Allcore (BIT:CORE) | €1.365 | €2.66 | 48.8% |
Here we highlight a subset of our preferred stocks from the screener.
Ferrari Group (ENXTAM:FERGR)
Overview: Ferrari Group PLC specializes in shipping, integrated logistics, and value-added services for jewelry and precious goods across Europe, Asia, North America, Brazil, and internationally with a market cap of €745.01 million.
Operations: The company generates its revenue primarily from Business Services, totaling €355.25 million.
Estimated Discount To Fair Value: 47.2%
Ferrari Group is trading at €8.16, significantly below its estimated fair value of €15.45, indicating it might be undervalued based on cash flows. Despite slower revenue growth forecasts (5.6% annually) compared to the Dutch market, earnings are expected to grow significantly at 22.4% per year, outpacing the market's 11.6%. Recent earnings reports show sales increased slightly year-over-year, though net income and EPS have declined notably over the same period.
- Upon reviewing our latest growth report, Ferrari Group's projected financial performance appears quite optimistic.
- Click here to discover the nuances of Ferrari Group with our detailed financial health report.

PostNL (ENXTAM:PNL)
Overview: PostNL N.V. offers postal and logistics services to businesses and consumers in the Netherlands, Europe, and internationally, with a market cap of €480.19 million.
Operations: The company's revenue is primarily derived from its Parcels segment, generating €2.41 billion, and the Mail in The Netherlands segment, contributing €1.32 billion.
Estimated Discount To Fair Value: 36.6%
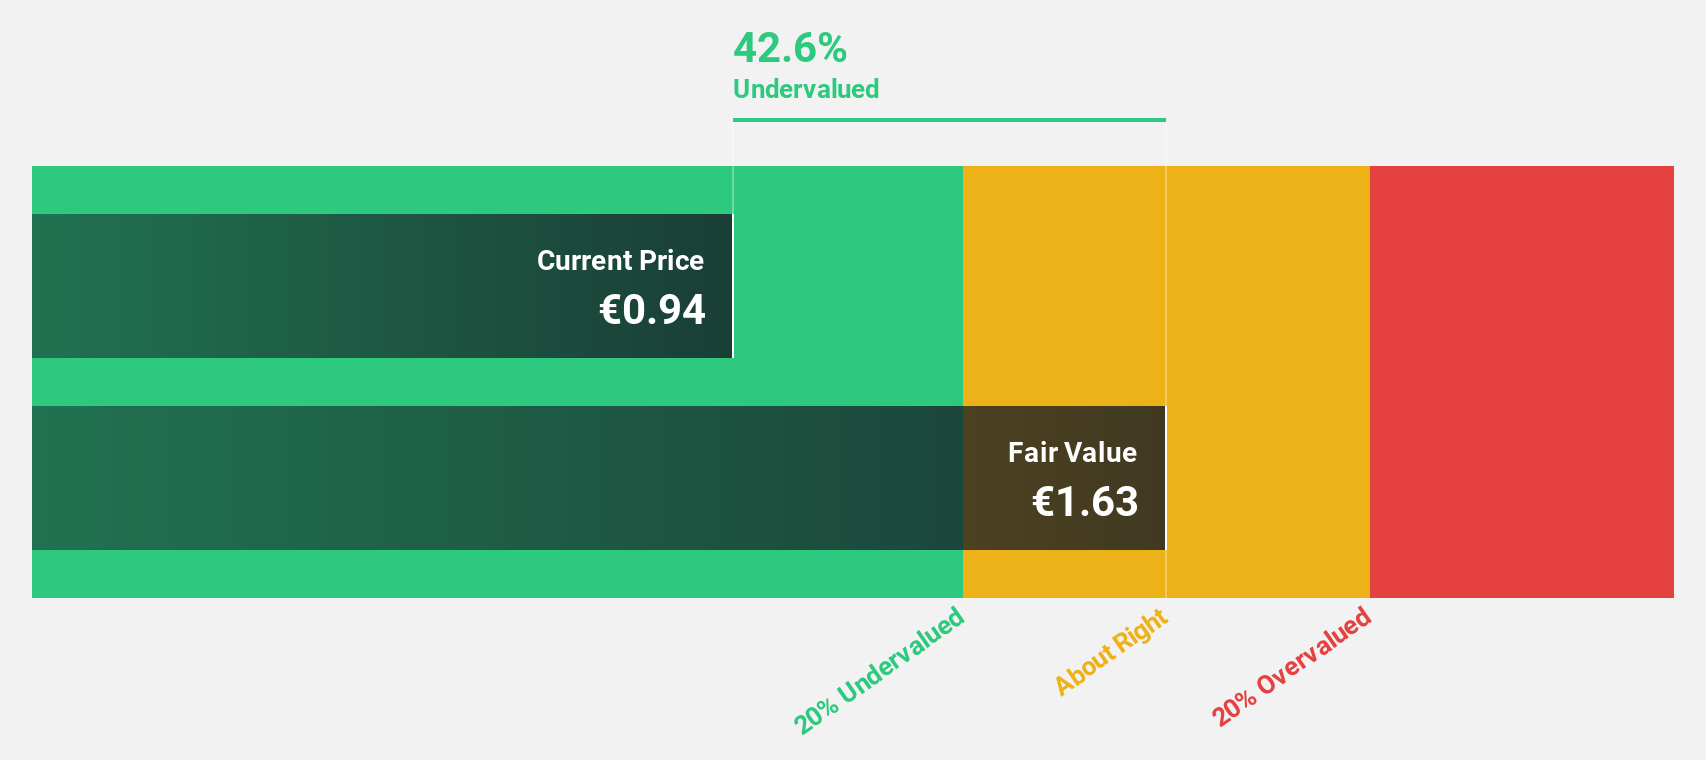
PostNL is trading at €0.94, below its estimated fair value of €1.49, highlighting potential undervaluation based on cash flows. Despite a recent net loss of €63 million for the nine months ending September 2025, earnings are forecast to grow significantly by 58.11% annually, with profitability expected in three years, surpassing market averages. However, interest payments and dividends remain inadequately covered by current earnings levels, presenting risks alongside growth prospects.
- Insights from our recent growth report point to a promising forecast for PostNL's business outlook.
- Dive into the specifics of PostNL here with our thorough financial health report.
Westwing Group (XTRA:WEW)
Overview: Westwing Group SE, along with its subsidiaries, operates in the home and living e-commerce retail sector with a market cap of €231.71 million.
Operations: Westwing Group SE generates its revenue from the home and living e-commerce retail sector.
Estimated Discount To Fair Value: 48.4%
Westwing Group SE is trading at €12.3, significantly below its estimated fair value of €23.82, suggesting undervaluation based on cash flows. Despite a net loss of €3.8 million in Q3 2025, the company showed improvement with a nine-month net income of €0.5 million compared to last year's loss. Earnings are forecasted to grow substantially by 68% annually, outpacing the German market average, although recent share price volatility poses potential risks.
- Our comprehensive growth report raises the possibility that Westwing Group is poised for substantial financial growth.
- Click to explore a detailed breakdown of our findings in Westwing Group's balance sheet health report.

Seize The Opportunity
- Investigate our full lineup of 194 Undervalued European Stocks Based On Cash Flows right here.
- Are you invested in these stocks already? Keep abreast of every twist and turn by setting up a portfolio with Simply Wall St, where we make it simple for investors like you to stay informed and proactive.
- Maximize your investment potential with Simply Wall St, the comprehensive app that offers global market insights for free.
Ready To Venture Into Other Investment Styles?
- Explore high-performing small cap companies that haven't yet garnered significant analyst attention.
- Diversify your portfolio with solid dividend payers offering reliable income streams to weather potential market turbulence.
- Fuel your portfolio with companies showing strong growth potential, backed by optimistic outlooks both from analysts and management.
This article by Simply Wall St is general in nature. We provide commentary based on historical data and analyst forecasts only using an unbiased methodology and our articles are not intended to be financial advice. It does not constitute a recommendation to buy or sell any stock, and does not take account of your objectives, or your financial situation. We aim to bring you long-term focused analysis driven by fundamental data. Note that our analysis may not factor in the latest price-sensitive company announcements or qualitative material. Simply Wall St has no position in any stocks mentioned.
Valuation is complex, but we're here to simplify it.
Discover if Westwing Group might be undervalued or overvalued with our detailed analysis, featuring fair value estimates, potential risks, dividends, insider trades, and its financial condition.
Access Free AnalysisHave feedback on this article? Concerned about the content? Get in touch with us directly. Alternatively, email editorial-team@simplywallst.com
About XTRA:WEW
Flawless balance sheet with high growth potential.
Similar Companies
Market Insights

Advertisement
Community Narratives
The "Molecular Pencil": Why Beam's Technology is Built to Win
Fair Value US$65.01|65.8% undervalued
DA
Community Contributor
The silent giant behind virtually every advanced chip powering AI, smartphones, and modern infrastructure.
Fair Value US$310.00|7.6% undervalued
OS
Community Contributor
ADP Stock: Solid Fundamentals, But AI Investments Test Its Margin Resilience
Fair Value US$387.77|34.5% undervalued
YI
Community Contributor