Advertisement
- Netherlands
- /
- Biotech
- /
- ENXTAM:PHARM
Pharming Group (ENXTAM:PHARM): Reassessing Valuation After Upbeat Revenue Outlook and Earnings Turnaround

Simply Wall St
Reviewed by Simply Wall St
Pharming Group (ENXTAM:PHARM) caught investors’ attention after raising its revenue outlook for 2025, now forecasting up to USD 375 million. This move follows impressive year-over-year sales growth and a significantly smaller net loss.
See our latest analysis for Pharming Group.
Pharming Group’s upbeat revenue guidance and narrowing net loss have clearly caught the market’s attention, with the share price leaping over 24% in a day and posting a remarkable 42.5% year-to-date gain. Over the past year, the total shareholder return has soared to 80.6%, a signal that momentum is building as investors respond to robust operational progress.
If strong momentum at Pharming Group has you thinking about what else is making waves, now's a great moment to discover fast growing stocks with high insider ownership
With shares at multi-year highs and future growth already top of mind, investors now face a key question: is Pharming Group undervalued at current levels, or has the market already factored in all the good news?
Price-to-Sales of 3.2x: Is it justified?
Pharming Group currently trades at a price-to-sales ratio of 3.2x, a level that signals attractive value relative to similar companies and industry peers. With recent positive momentum in revenue and outlook, current market pricing is sharply below typical multiples seen elsewhere in the biotech sector.
The price-to-sales ratio compares the current market capitalization to annual revenues, serving as a popular yardstick for high-growth or unprofitable biotech firms. Since earnings can be negative or volatile in this space, sales-based metrics help investors judge value independently of earnings trends.
At 3.2x, Pharming Group’s multiple is significantly lower than both its peer group average of 15.1x and the European sector’s 8.5x. This positions it as potentially overlooked or conservatively valued. According to regression-based analysis, a ratio of 5.2x could be more appropriate, so there is meaningful scope for upward price adjustment if the market's perception shifts closer to fundamental value.
Explore the SWS fair ratio for Pharming Group
Result: Price-to-Sales of 3.2x (UNDERVALUED)
However, slower-than-expected revenue growth or any regulatory hurdles could quickly dampen the strong momentum that has been seen in Pharming Group’s share price.
Find out about the key risks to this Pharming Group narrative.
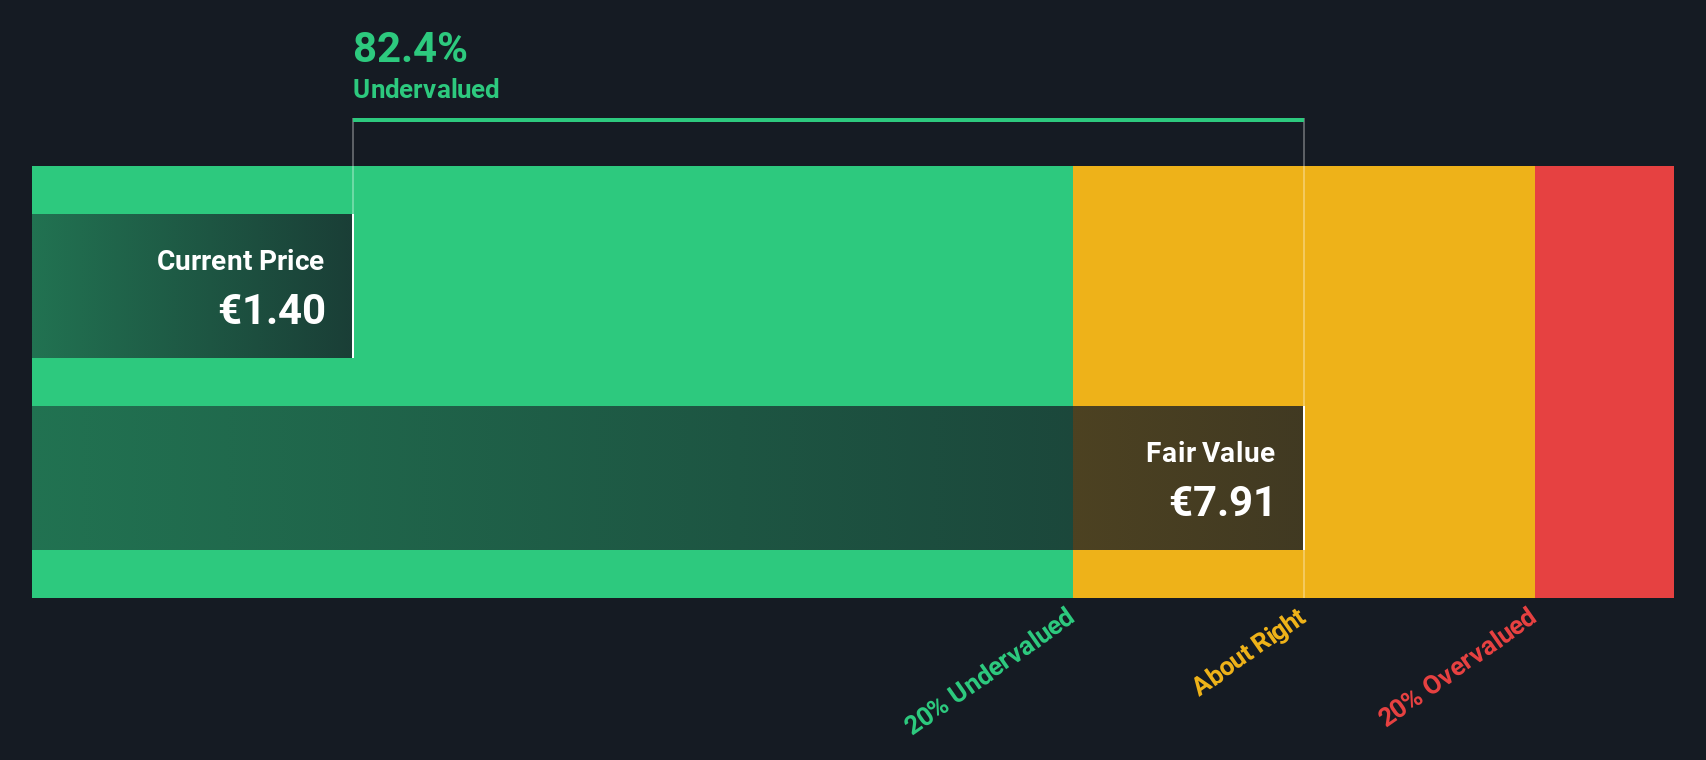
Another View: Discounted Cash Flow Signals Even Deeper Value
While the price-to-sales ratio presents Pharming Group as undervalued, a different picture emerges from our DCF (Discounted Cash Flow) model. According to this approach, the share is trading at a massive 82.8% discount to its estimated fair value. Could the market be missing something? Alternatively, is there a reason for such a wide valuation gap?
Look into how the SWS DCF model arrives at its fair value.
Simply Wall St performs a discounted cash flow (DCF) on every stock in the world every day (check out Pharming Group for example). We show the entire calculation in full. You can track the result in your watchlist or portfolio and be alerted when this changes, or use our stock screener to discover 863 undervalued stocks based on their cash flows. If you save a screener we even alert you when new companies match - so you never miss a potential opportunity.
Build Your Own Pharming Group Narrative
If you think differently, or want to dig into the data your own way, you can create your own narrative in just minutes. Do it your way
A great starting point for your Pharming Group research is our analysis highlighting 3 key rewards and 1 important warning sign that could impact your investment decision.
Looking for more investment ideas?
Stay ahead of the market by tapping into promising trends. Unlock your next opportunity with a few smart clicks using Simply Wall Street’s powerful screeners.
- Capture high yields and steady income by starting with these 17 dividend stocks with yields > 3% offering exceptional returns above 3%.
- Tap into the booming potential of artificial intelligence by checking out these 25 AI penny stocks poised for future growth and innovation.
- Seize valuable bargains in today's market through these 863 undervalued stocks based on cash flows that stand out based on strong cash flow fundamentals.
This article by Simply Wall St is general in nature. We provide commentary based on historical data and analyst forecasts only using an unbiased methodology and our articles are not intended to be financial advice. It does not constitute a recommendation to buy or sell any stock, and does not take account of your objectives, or your financial situation. We aim to bring you long-term focused analysis driven by fundamental data. Note that our analysis may not factor in the latest price-sensitive company announcements or qualitative material. Simply Wall St has no position in any stocks mentioned.
New: Manage All Your Stock Portfolios in One Place
We've created the ultimate portfolio companion for stock investors, and it's free.
• Connect an unlimited number of Portfolios and see your total in one currency
• Be alerted to new Warning Signs or Risks via email or mobile
• Track the Fair Value of your stocks
Have feedback on this article? Concerned about the content? Get in touch with us directly. Alternatively, email editorial-team@simplywallst.com
About ENXTAM:PHARM
Pharming Group
A biopharmaceutical company, develops and commercializes protein replacement therapies and precision medicines for the treatment of rare diseases in the United States, Europe, and internationally.
Flawless balance sheet and undervalued.
Similar Companies
Market Insights

Advertisement
Community Narratives
The company that turned a verb into a global necessity and basically runs the modern internet, digital ads, smartphones, maps, and AI.
Fair Value US$300.00|5.1% undervalued
OS
Community Contributor
Flowers Foods Pays A Fair Price For Health
Fair Value US$16.12|27.7% undervalued
NV
Community Contributor
TMX Group will thrive with 33.3% profit margin and enduring market moat
Fair Value CA$49.90|0.2% overvalued
LI
Community Contributor
The "Molecular Pencil": Why Beam's Technology is Built to Win
Fair Value US$65.01|64.4% undervalued
DA
Community Contributor