- Netherlands
- /
- Food and Staples Retail
- /
- ENXTAM:ACOMO
Top Dividend Stocks On Euronext Amsterdam For August 2024

Reviewed by Simply Wall St

As European equity markets show mixed results amid fluctuating earnings reports and economic data, investors are keeping a close eye on dividend stocks listed on Euronext Amsterdam. In this environment, identifying reliable dividend stocks can provide stability and income, particularly when market volatility is high.
Top 5 Dividend Stocks In The Netherlands
| Name | Dividend Yield | Dividend Rating |
| Koninklijke Heijmans (ENXTAM:HEIJM) | 3.35% | ★★★★☆☆ |
| ABN AMRO Bank (ENXTAM:ABN) | 9.26% | ★★★★☆☆ |
| Signify (ENXTAM:LIGHT) | 6.77% | ★★★★☆☆ |
| Randstad (ENXTAM:RAND) | 5.08% | ★★★★☆☆ |
| Aalberts (ENXTAM:AALB) | 3.21% | ★★★★☆☆ |
| Acomo (ENXTAM:ACOMO) | 6.66% | ★★★★☆☆ |
Let's dive into some prime choices out of the screener.
Acomo (ENXTAM:ACOMO)
Simply Wall St Dividend Rating: ★★★★☆☆
Overview: Acomo N.V., with a market cap of €511.20 million, specializes in sourcing, trading, processing, packaging, and distributing conventional and organic food ingredients and solutions for the food and beverage industry across the Netherlands, other European countries, North America, and internationally.
Operations: Acomo N.V. generates revenue from various segments including Tea (€124.04 million), Edible Seeds (€246.52 million), Food Solutions (€23.47 million), Spices and Nuts (€445.76 million), and Organic Ingredients (€429.28 million).
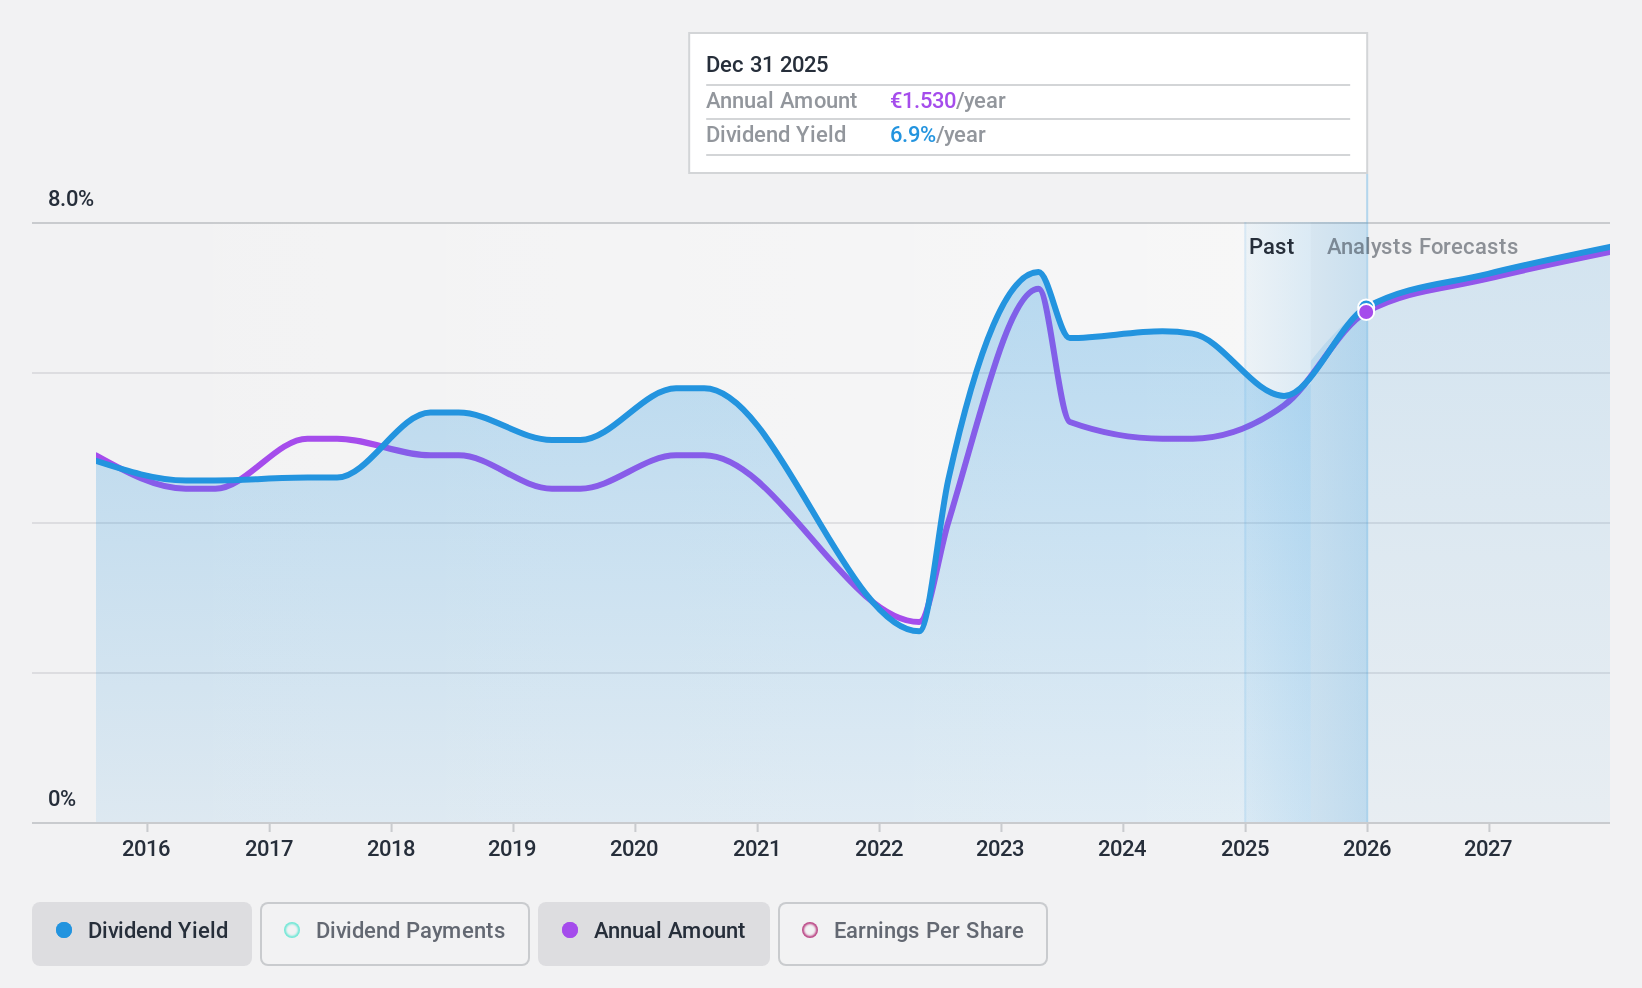
Dividend Yield: 6.7%
Acomo's dividend payments have increased over the past 10 years but have been unreliable and volatile. The current dividend yield of 6.66% places it in the top 25% of Dutch market payers, yet it's not well covered by earnings with a high payout ratio of 95.7%. Despite a reasonable cash payout ratio (51%), recent financials show declining net income (€17.94 million) and EPS (€0.61), raising concerns about sustainability given its high debt level.
- Delve into the full analysis dividend report here for a deeper understanding of Acomo.
- According our valuation report, there's an indication that Acomo's share price might be on the expensive side.
Koninklijke Heijmans (ENXTAM:HEIJM)
Simply Wall St Dividend Rating: ★★★★☆☆
Overview: Koninklijke Heijmans N.V. operates in property development, construction, and infrastructure sectors both in the Netherlands and internationally, with a market cap of €713.57 million.
Operations: Koninklijke Heijmans N.V. generates revenue of €871.03 million from its Connecting segment and €1.83 billion from Segment Adjustment activities.
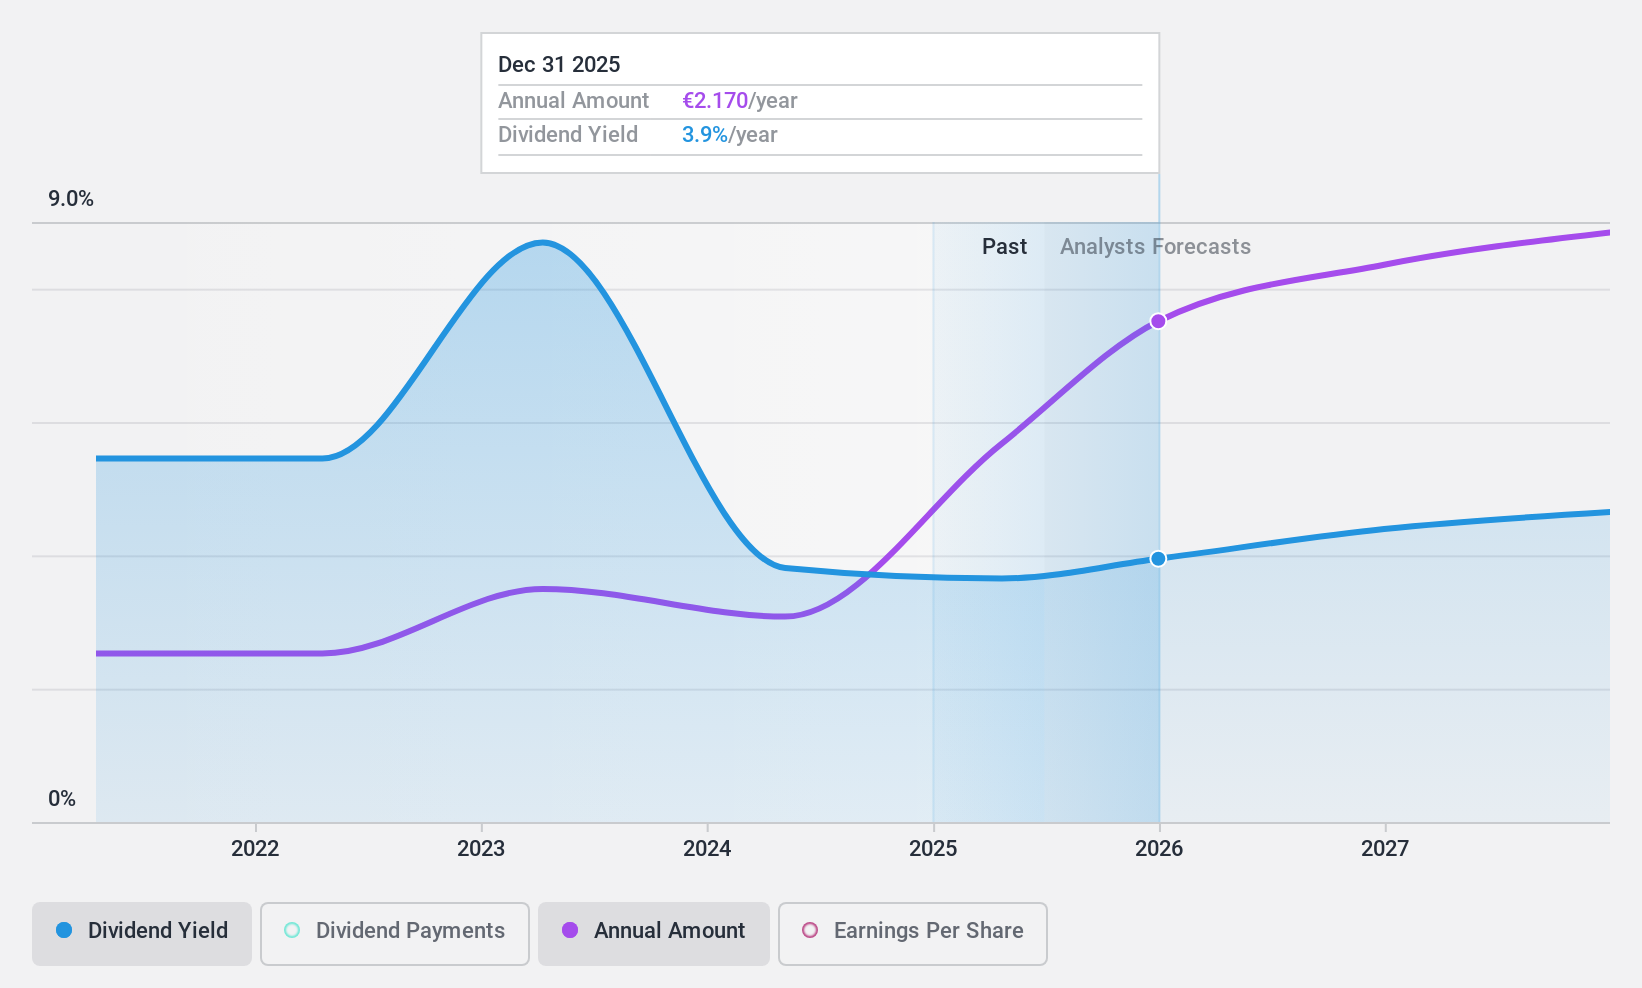
Dividend Yield: 3.3%
Koninklijke Heijmans N.V. has a low cash payout ratio (20.7%), ensuring its dividends are well covered by cash flows and earnings (30% payout ratio). However, its dividend yield of 3.35% is below the top 25% in the Dutch market. Despite significant earnings growth of 65.5% over the past year, recent results show net income of €37 million for H1 2024, up from €18 million a year ago, but shareholders have faced dilution and an unstable dividend track record.
- Dive into the specifics of Koninklijke Heijmans here with our thorough dividend report.
- Upon reviewing our latest valuation report, Koninklijke Heijmans' share price might be too pessimistic.
Randstad (ENXTAM:RAND)
Simply Wall St Dividend Rating: ★★★★☆☆
Overview: Randstad N.V. offers work and human resources (HR) solutions with a market cap of €7.88 billion.
Operations: Randstad N.V.'s revenue segments encompass a range of HR services and work solutions.
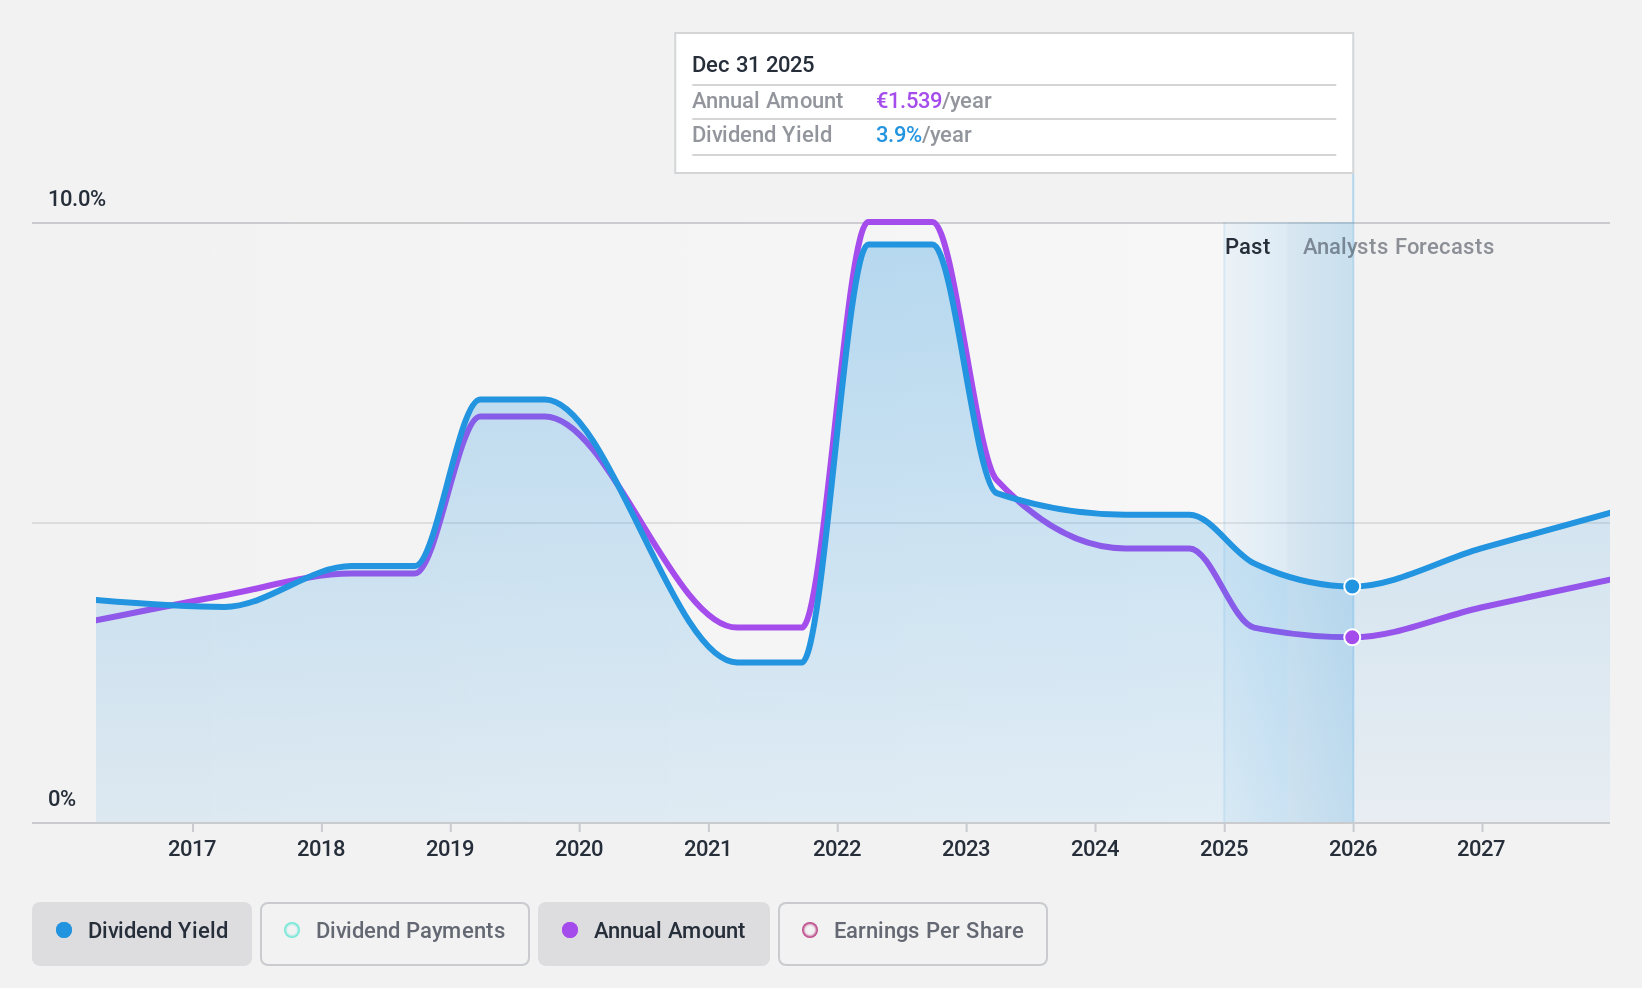
Dividend Yield: 5.1%
Randstad N.V.'s dividend payments are covered by earnings (81.3% payout ratio) and cash flows (51.5% cash payout ratio), but its dividend track record has been volatile over the past decade. Despite trading at 51.4% below fair value, recent Q2 2024 results show a decline in sales (€6.09 billion vs €6.47 billion) and net income (€78 million vs €137 million). The dividend yield of 5.08% is lower than the top quartile in the Dutch market.
- Click here to discover the nuances of Randstad with our detailed analytical dividend report.
- Our valuation report here indicates Randstad may be undervalued.
Next Steps
- Unlock our comprehensive list of 6 Top Euronext Amsterdam Dividend Stocks by clicking here.
- Have a stake in these businesses? Integrate your holdings into Simply Wall St's portfolio for notifications and detailed stock reports.
- Simply Wall St is a revolutionary app designed for long-term stock investors, it's free and covers every market in the world.
Searching for a Fresh Perspective?
- Explore high-performing small cap companies that haven't yet garnered significant analyst attention.
- Fuel your portfolio with companies showing strong growth potential, backed by optimistic outlooks both from analysts and management.
- Find companies with promising cash flow potential yet trading below their fair value.
This article by Simply Wall St is general in nature. We provide commentary based on historical data and analyst forecasts only using an unbiased methodology and our articles are not intended to be financial advice. It does not constitute a recommendation to buy or sell any stock, and does not take account of your objectives, or your financial situation. We aim to bring you long-term focused analysis driven by fundamental data. Note that our analysis may not factor in the latest price-sensitive company announcements or qualitative material. Simply Wall St has no position in any stocks mentioned.
New: Manage All Your Stock Portfolios in One Place
We've created the ultimate portfolio companion for stock investors, and it's free.
• Connect an unlimited number of Portfolios and see your total in one currency
• Be alerted to new Warning Signs or Risks via email or mobile
• Track the Fair Value of your stocks
Have feedback on this article? Concerned about the content? Get in touch with us directly. Alternatively, email editorial-team@simplywallst.com
About ENXTAM:ACOMO
Acomo
Engages in sourcing, trading, processing, packaging, and distributing conventional and organic food ingredients and solutions for the food and beverage industry in the Netherlands, other European countries, North America, and internationally.
Adequate balance sheet average dividend payer.
